Google Data Studio vs Power BI: Free Google Dashboards vs Microsoft's BI Platform
Google Data Studio (now Looker Studio) is free and Google-native. Power BI is powerful and Microsoft-native. They are the two most popular BI tools for teams that do not want to pay Tableau pricing. This guide compares them on everything that matters: pricing, data modeling, connectors, governance, and who each tool is built for.
Note: Google rebranded Data Studio to "Looker Studio" in October 2022. Same product, new name. This article uses "Google Data Studio" for search purposes, but everything here applies to the current Looker Studio product.
Google Data Studio Overview
Free, browser-based dashboard builder with 1,000+ data connectors and native Google ecosystem integration.
Price: Free. Looker Studio Pro (the rebranded version) adds team features at $9/user/month.
Strengths:
- Completely free with full functionality
- Native connectors for GA4, Google Ads, Sheets, BigQuery, Search Console
- 1,000+ partner connectors
- Low learning curve — drag-and-drop, no coding
- Real-time collaboration (Google Docs style)
- Browser-based, works on any OS
Weaknesses:
- 5-source data blending limit (JOIN only)
- No real data modeling or semantic layer
- Basic calculated fields — no DAX equivalent
- Performance degrades with large datasets
- Basic governance (Owner/Editor/Viewer)
- No R/Python, no ML, no advanced analytics
- Third-party connectors cost $39–$200/month
Power BI Overview
Microsoft's BI platform with desktop authoring, DAX formula language, Power Query ETL, and deep Azure integration.
Price: Free desktop (Windows only). Pro: $10/user/month. Premium: $20/user/month or $4,995/month capacity.
Strengths:
- DAX for complex calculations and time intelligence
- Power Query for built-in data transformation
- DirectQuery for real-time warehouse queries
- Row-level security, Azure AD, encryption, audit logs
- R and Python integration
- AppSource marketplace with custom visuals
- Paginated reports for compliance
- Best price-to-power ratio of any paid BI tool
Weaknesses:
- Windows-only desktop app
- Steep DAX learning curve
- Microsoft ecosystem lock-in
- Overwhelming interface for beginners
- Premium pricing scales fast
Feature Comparison
Feature: Price · Google Data Studio: Free · Power BI: Free desktop; $10–$20/user/mo
Feature: Data Modeling · Google Data Studio: Calculated fields · Power BI: DAX + Power Query + star schema
Feature: Data Sources · Google Data Studio: 1,000+ (cached) · Power BI: 200+ (DirectQuery + import)
Feature: ETL · Google Data Studio: None · Power BI: Power Query (built-in)
Feature: Visualization · Google Data Studio: Basic + community · Power BI: Extensive + AppSource
Feature: Advanced Analytics · Google Data Studio: None · Power BI: R/Python, AI insights, forecasting
Feature: Governance · Google Data Studio: Basic (3 roles) · Power BI: Row-level security, Azure AD
Feature: Collaboration · Google Data Studio: Real-time co-editing · Power BI: Workspaces + Teams
Feature: Platform · Google Data Studio: Browser (any OS) · Power BI: Windows desktop + web + mobile
Feature: Learning Curve · Google Data Studio: Low · Power BI: High
Feature: Best Ecosystem · Google Data Studio: Google · Power BI: Microsoft
Pricing for a 10-Person Team
Google Data Studio: $0/month (or $90/month on Looker Studio Pro) Power BI Pro: $100/month (10 x $10) Power BI Premium Per User: $200/month (10 x $20)
For basic reporting, the free option is hard to beat. For advanced modeling, Power BI Pro at $10/user is excellent value.
When to Choose Google Data Studio
- Budget is zero
- Google ecosystem (GA4, Ads, Sheets, BigQuery) is your primary stack
- Non-technical users build the reports
- Simple marketing dashboards and KPI tracking
- Mac or Linux users (Power BI Desktop is Windows-only)
- Speed of setup over analytical depth
When to Choose Power BI
- Microsoft ecosystem (Azure, SQL Server, Excel, Teams)
- Complex data modeling with DAX is needed
- Built-in ETL via Power Query is valuable
- Enterprise governance with row-level security is required
- Financial reporting, forecasting, or statistical analysis
- Budget supports $10–$20/user/month
Why Teams Are Switching to Graphed
Google Data Studio tops out at basic dashboards. Power BI is powerful but demands DAX expertise and a Windows machine. Both require manual dashboard building and ongoing maintenance.
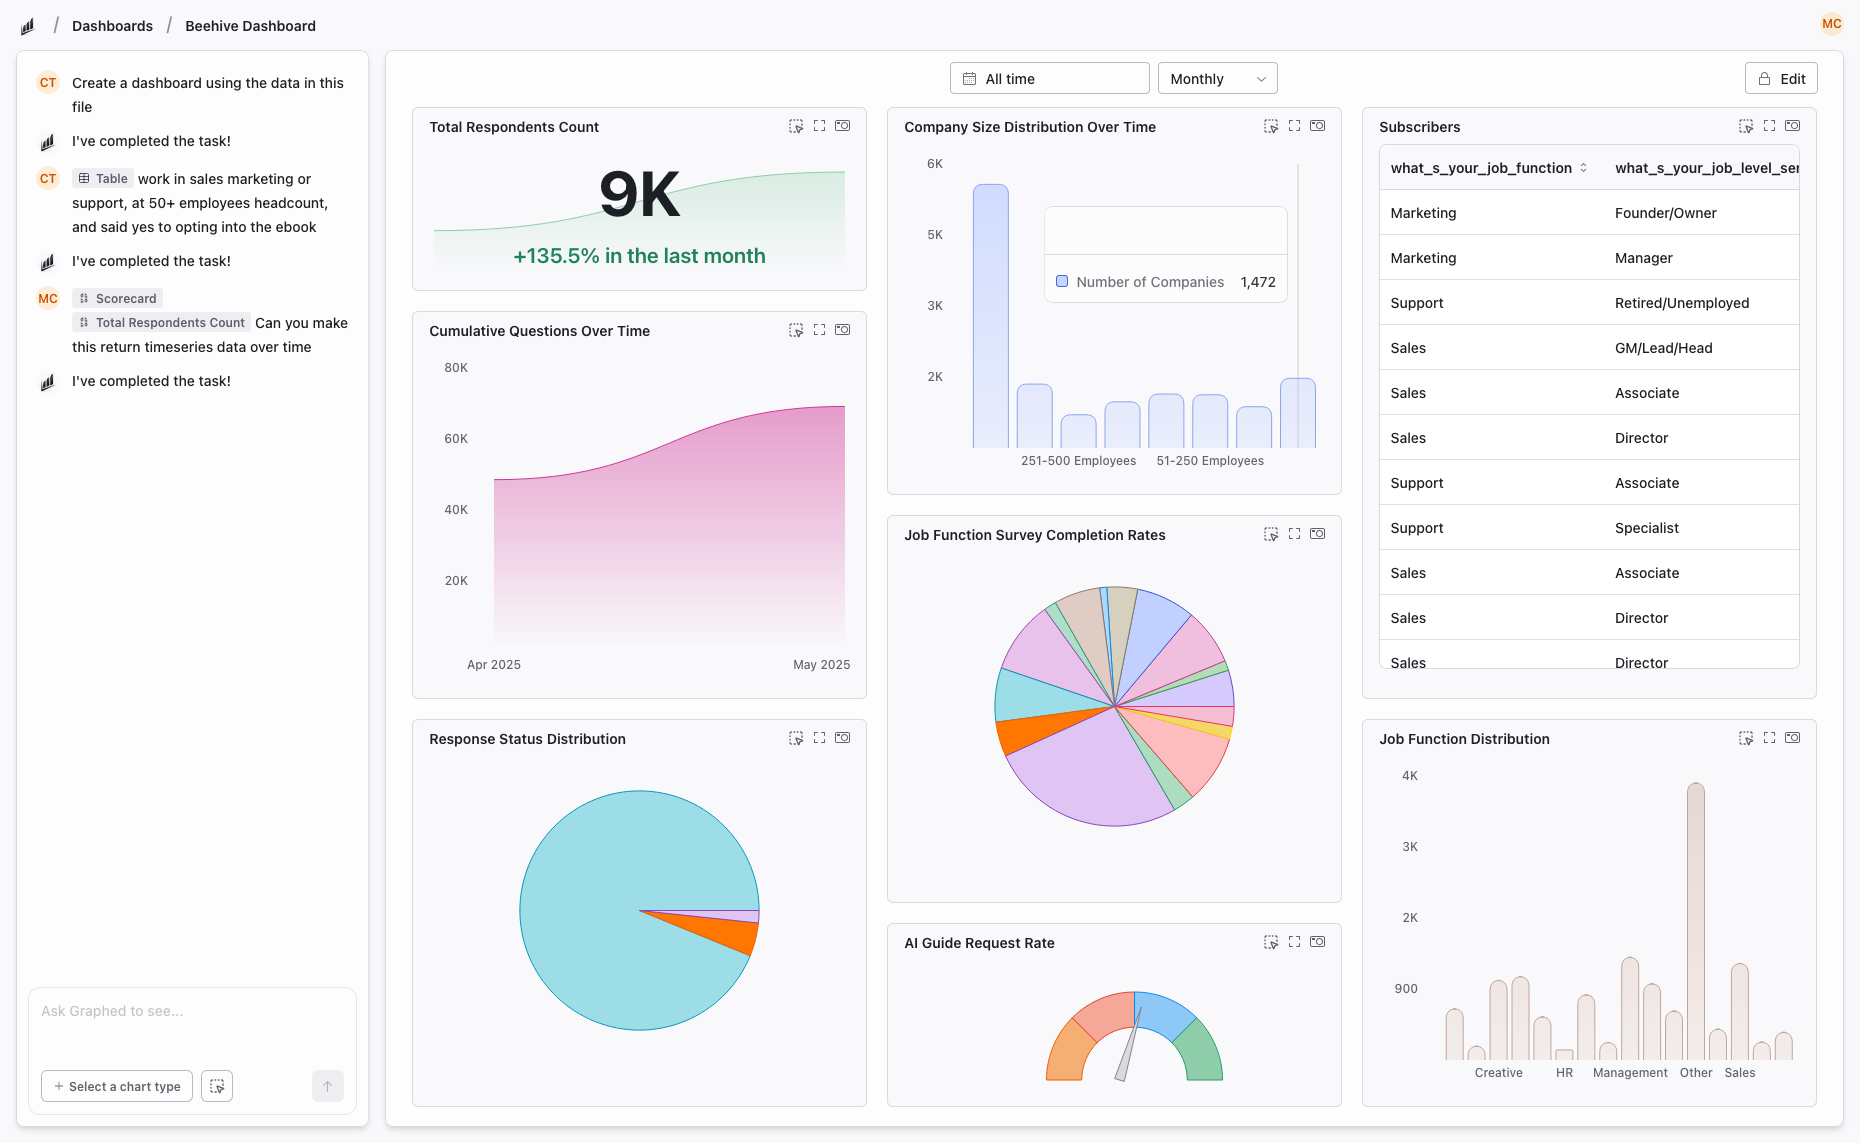
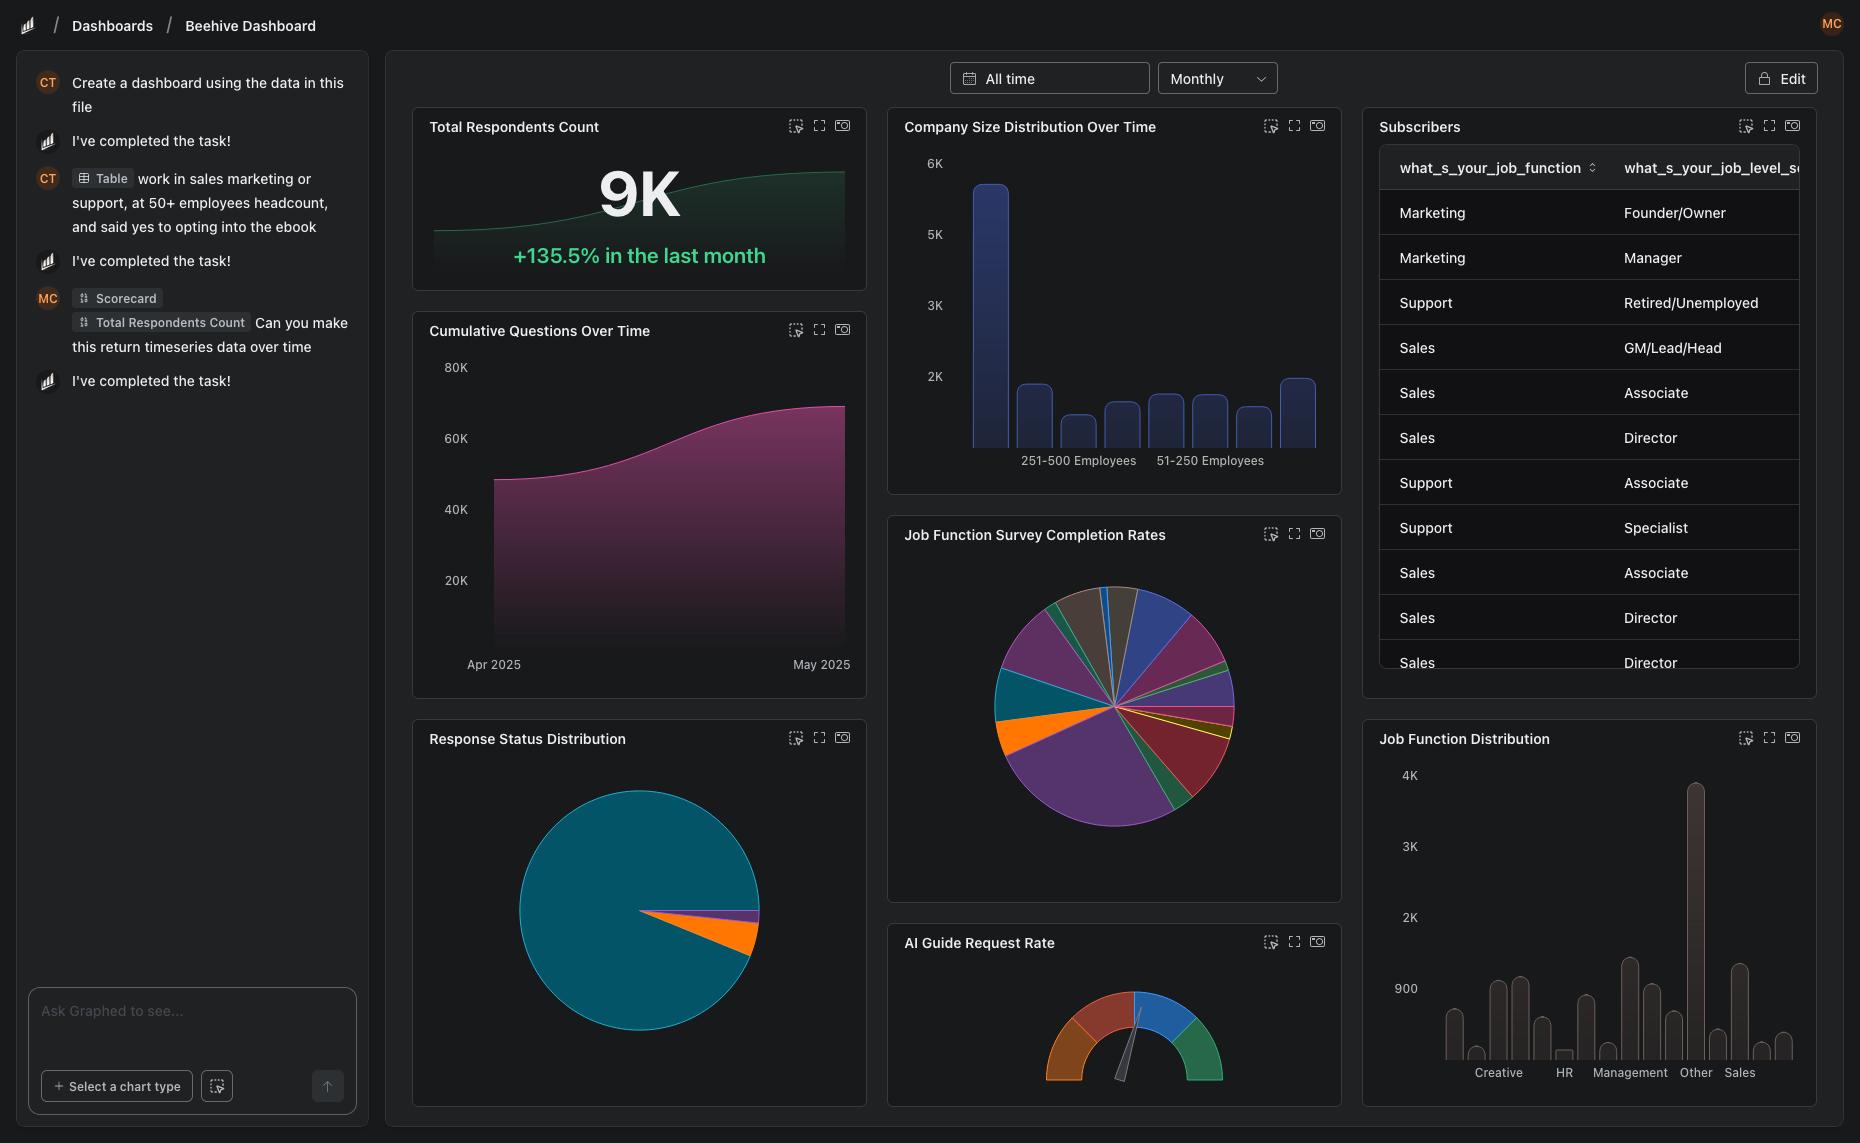
Graphed is an AI data analyst that connects to data sources from both ecosystems — GA4, Google Ads, Meta Ads, HubSpot, Shopify, Stripe, Salesforce, and 350+ more — and builds dashboards from natural language. No DAX formulas. No drag-and-drop canvas. Describe what you need, and the AI creates it.
Data syncs hourly. Setup takes 15 minutes. First dashboard in 24 hours. No ecosystem lock-in, no learning curve, no manual maintenance.
The Bottom Line
Google Data Studio wins on cost and simplicity. Power BI wins on data modeling and enterprise features. Your choice depends on which ecosystem you live in and how complex your analytics needs are. For simple Google-stack dashboards, Data Studio is unbeatable. For serious data modeling, Power BI delivers more per dollar than any competitor.
Related Articles
How to Create a Photo Album in Meta Business Suite
How to create a photo album in Meta Business Suite — step-by-step guide to organizing Facebook and Instagram photos into albums for your business page.
Is Google Analytics and Data Analytics the Same?
Is Google Analytics and data analytics the same? No — Google Analytics is one tool, data analytics is the broader discipline. Here is the difference.
What Database Does Tableau Use?
What database does Tableau use? Tableau connects to 100+ databases — it does not store data itself. Learn how live connections and extracts work.