Google Data Studio vs Power BI vs Tableau: Three BI Tools Compared
Google Data Studio, Power BI, and Tableau are the three most searched BI tools. One is free. One offers the best value. One has the best visualizations. This guide gives you the honest comparison so you can stop reading reviews and start building.
Note: Google rebranded Data Studio to "Looker Studio" in October 2022. Same tool, new name.
Quick Decision
- Google Data Studio → Free dashboards, Google ecosystem, non-technical users
- Power BI → Advanced modeling, Microsoft ecosystem, best value per dollar
- Tableau → Best visualizations, exploratory analysis, premium budget
Google Data Studio
Price: Free (Pro: $9/user/month) Ecosystem: Google (GA4, Ads, Sheets, BigQuery) Learning curve: Low
Best at: Quick, free dashboards from Google data. Real-time collaboration. Zero setup. Worst at: Data modeling, large datasets, governance, advanced analytics.
Power BI
Price: Free desktop (Windows). Pro: $10/user/month. Premium: $20/user/month. Ecosystem: Microsoft (Azure, SQL Server, Excel, Teams) Learning curve: High (DAX)
Best at: Data modeling (DAX + Power Query), built-in ETL, enterprise governance, price-to-feature ratio. Worst at: Mac support (Windows desktop only), beginner friendliness, non-Microsoft ecosystems.
Tableau
Price: Creator: $75/user/month. Explorer: $42/user/month. Viewer: $15/user/month. Ecosystem: Salesforce, databases Learning curve: Medium-High
Best at: Visualization depth and variety, exploratory analysis, LOD expressions, deployment flexibility. Worst at: Cost, requires separate ETL, Salesforce integration pressure.
Comparison Table
Feature: Price (10 users) · Google Data Studio: $0/month · Power BI: $100–$200/month · Tableau: $351+/month
Feature: Data Modeling · Google Data Studio: Basic calcs · Power BI: DAX + Power Query · Tableau: LOD + table calcs
Feature: ETL · Google Data Studio: None · Power BI: Power Query (built-in) · Tableau: Tableau Prep
Feature: Visualization · Google Data Studio: Basic · Power BI: Good + AppSource · Tableau: Best in class
Feature: Governance · Google Data Studio: Basic · Power BI: Enterprise · Tableau: Enterprise
Feature: Advanced Analytics · Google Data Studio: None · Power BI: R/Python, AI · Tableau: AI, Einstein
Feature: Connectors · Google Data Studio: 1,000+ · Power BI: 200+ · Tableau: 100+
Feature: Collaboration · Google Data Studio: Real-time · Power BI: Workspaces · Tableau: Server/Cloud
Feature: Mobile · Google Data Studio: Responsive · Power BI: Native app · Tableau: Native app
Feature: Platform · Google Data Studio: Browser · Power BI: Windows + web · Tableau: Desktop + web
Cost Comparison (20-person team: 3 builders, 7 editors, 10 viewers)
Tool: Google Data Studio · Monthly Cost: $0
Tool: Google Data Studio Pro · Monthly Cost: $180
Tool: Power BI Pro · Monthly Cost: $200
Tool: Power BI Premium · Monthly Cost: $400
Tool: Tableau · Monthly Cost: $669
Decision Matrix
Your Situation: Zero budget · Choose: Google Data Studio
Your Situation: Google ecosystem, simple needs · Choose: Google Data Studio
Your Situation: Microsoft ecosystem, need modeling · Choose: Power BI
Your Situation: Best value with advanced features · Choose: Power BI Pro
Your Situation: Best visualizations, budget available · Choose: Tableau
Your Situation: Exploratory ad-hoc analysis · Choose: Tableau
Your Situation: Mac-only team · Choose: Google Data Studio or Tableau
Your Situation: Enterprise governance required · Choose: Power BI or Tableau
Why None of These May Be What You Need
All three tools share the same limitation: someone on your team must manually build and maintain every dashboard. Data Studio makes it easy but shallow. Power BI makes it powerful but complex. Tableau makes it beautiful but expensive. The manual work is constant.
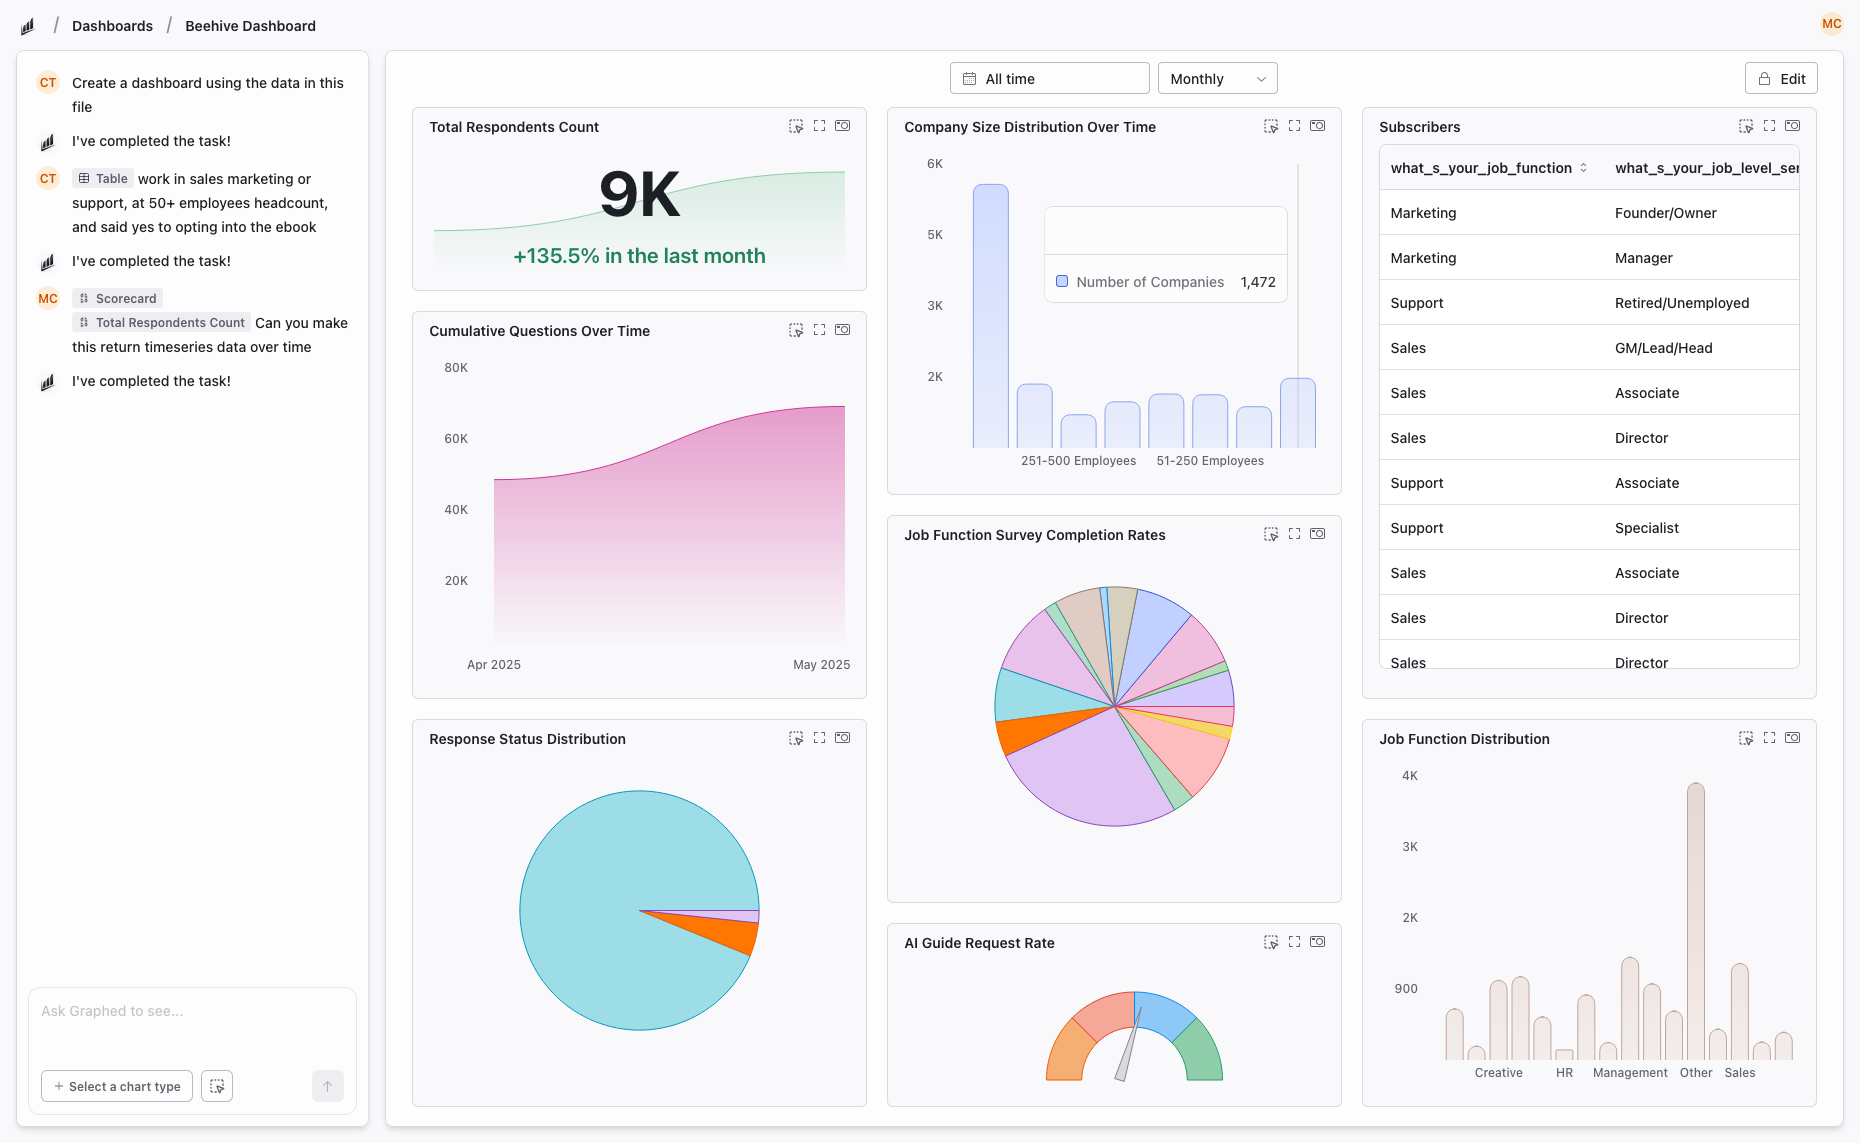
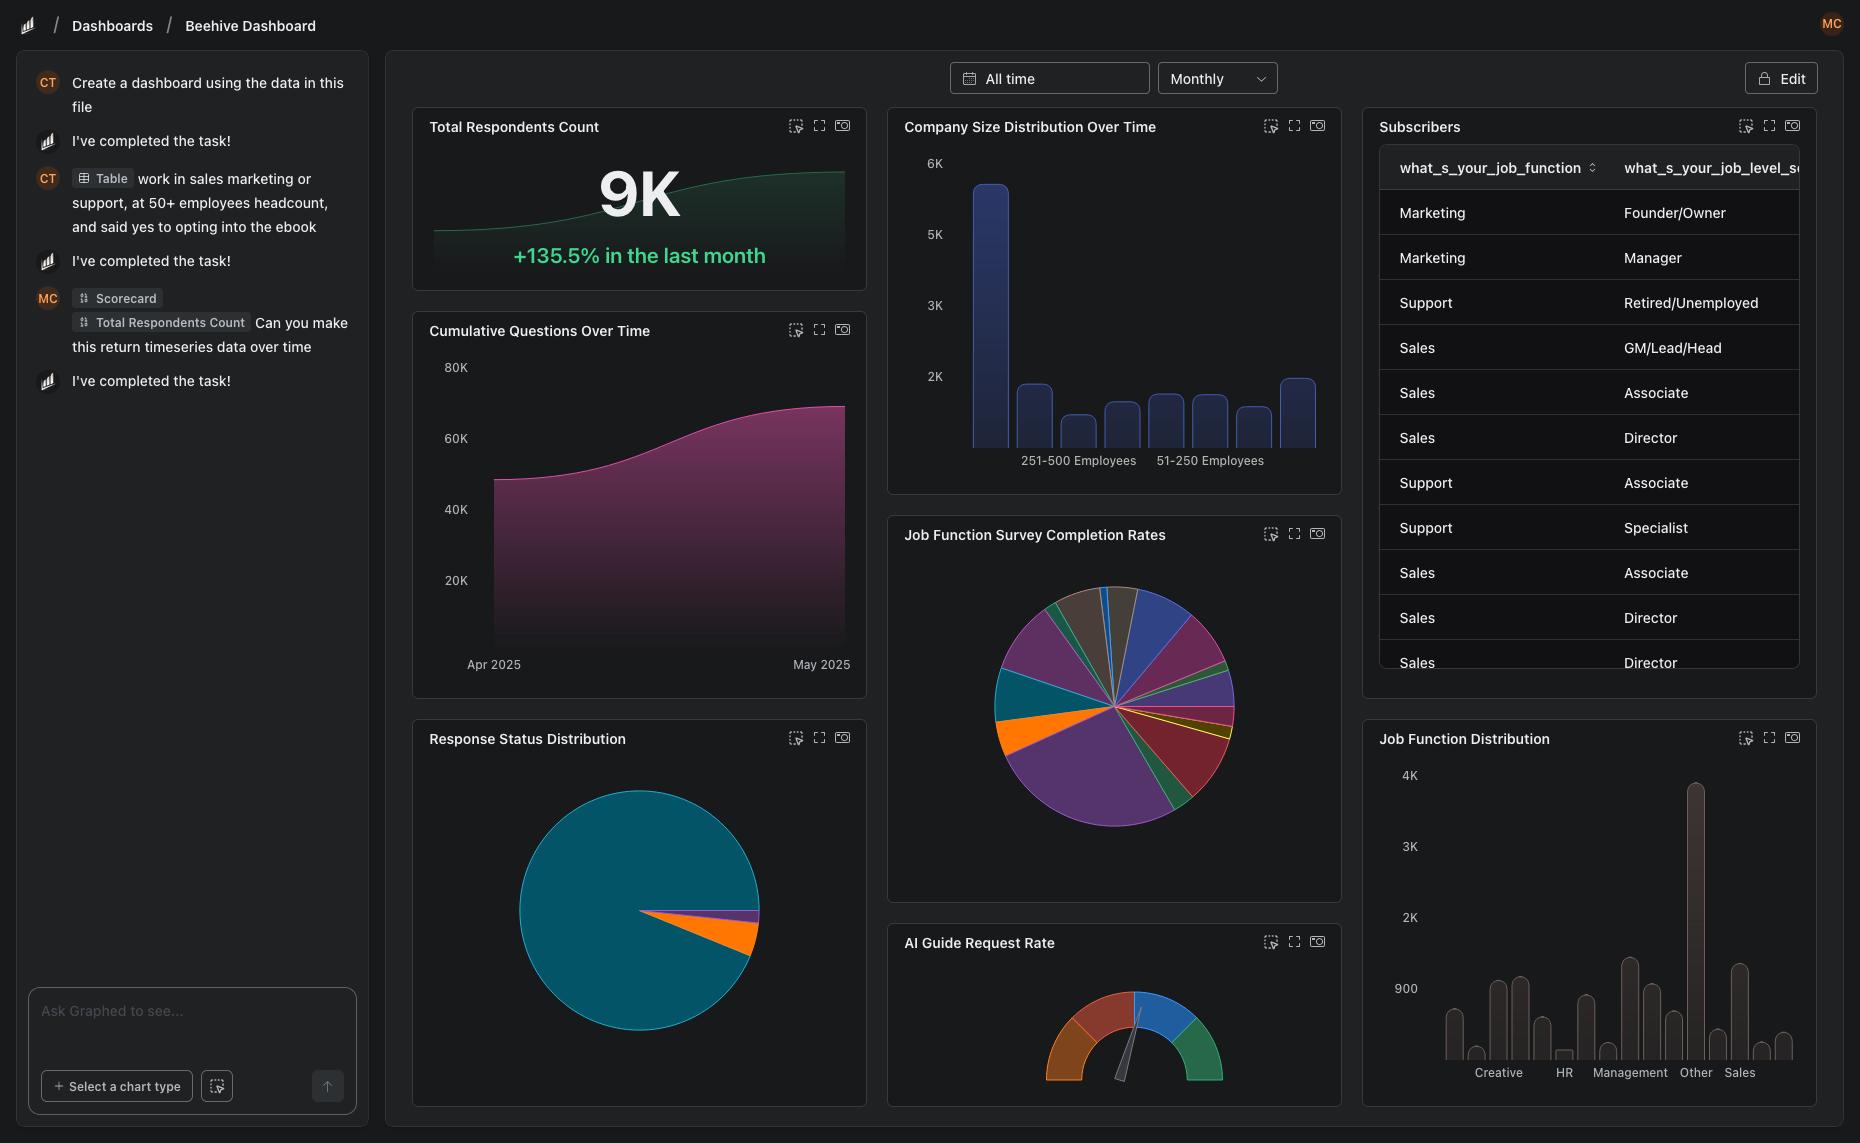
Graphed removes the manual step entirely. It is an AI data analyst that connects to 350+ data sources and builds dashboards from natural language. No DAX, no LOD expressions, no drag-and-drop. Describe what you want, the AI delivers it. Data syncs hourly, setup takes 15 minutes, first dashboard in 24 hours.
If you are debating which manual dashboard tool to use, the better question might be whether you need to build dashboards manually at all.
The Bottom Line
Google Data Studio for free simplicity. Power BI for advanced modeling at fair pricing. Tableau for premium visualization. Your choice depends on ecosystem, budget, and team skills. There is no universal winner — only the right fit for your situation.
Related Articles
How to Create a Photo Album in Meta Business Suite
How to create a photo album in Meta Business Suite — step-by-step guide to organizing Facebook and Instagram photos into albums for your business page.
Is Google Analytics and Data Analytics the Same?
Is Google Analytics and data analytics the same? No — Google Analytics is one tool, data analytics is the broader discipline. Here is the difference.
What Database Does Tableau Use?
What database does Tableau use? Tableau connects to 100+ databases — it does not store data itself. Learn how live connections and extracts work.