Google Data Studio vs Tableau: Free Reporting vs Premium Visualization
Google Data Studio (now Looker Studio) and Tableau represent opposite ends of the BI spectrum. One is free and built for simplicity. The other costs $75/user/month and delivers the deepest visualization engine in the industry. This guide covers the real differences — features, pricing, learning curve, and who each tool actually serves.
Note: Google rebranded Data Studio to "Looker Studio" in October 2022. The product is identical — same features, same interface, new name. This article uses "Google Data Studio" because that is what people search for, but everything here applies to Looker Studio as well.
Google Data Studio Overview
Google Data Studio is a free, browser-based dashboard builder. It connects to data sources via 1,000+ connectors — with native support for Google products — and lets anyone build interactive reports with drag-and-drop charts and filters.
Price: Free. The rebranded version (Looker Studio) has an optional Pro tier at $9/user/month.
Strengths:
- Completely free
- Native Google ecosystem connectors (GA4, Ads, Sheets, BigQuery, Search Console)
- 1,000+ third-party partner connectors
- Low learning curve — non-technical users can build dashboards in minutes
- Real-time collaboration (Google Docs style)
- Templates for quick-start reporting
- No installation required (browser-based)
Weaknesses:
- Limited visualization options — basic chart types with few customization options
- 5-source data blending cap (JOIN only, no UNION)
- No data modeling or semantic layer
- Performance issues with large datasets
- Basic governance (Owner/Editor/Viewer)
- No advanced analytics, no R/Python, no predictive modeling
- Third-party connectors cost $39–$200/month each
Best for: Marketing teams, small businesses, and non-technical users building dashboards from Google ecosystem data.
Tableau Overview
Tableau is the industry leader in data visualization. It offers the widest range of chart types, the most granular design controls, and powerful exploratory analysis through its drag-and-drop interface. Acquired by Salesforce in 2019, it is the go-to tool for data teams that prioritize visual storytelling.
Price: Creator: $75/user/month. Explorer: $42/user/month. Viewer: $15/user/month.
Strengths:
- Best-in-class visualization library (treemaps, heatmaps, waterfall, sankey, box plots, bullet charts, and custom combinations)
- Level of Detail (LOD) expressions for multi-granularity calculations
- Tableau Prep for visual data cleaning and transformation
- 100+ native data connectors including databases, files, and cloud platforms
- Deployment flexibility — Desktop, Server, or Cloud
- AI features (Ask Data, Explain Data, Einstein Discovery)
- Largest BI community, extensive training resources, Tableau Public
- Strong governance with row-level security and project permissions
Weaknesses:
- Most expensive mainstream BI tool ($75/user for Creator)
- Requires separate ETL infrastructure for production workflows
- Desktop app needed for full authoring (Windows/Mac)
- Steep learning curve for LOD expressions and advanced features
- Salesforce acquisition has shifted product priorities
Best for: Data teams that need best-in-class visualizations, exploratory analysis, and have the budget and skills to maximize the platform.
Head-to-Head Comparison
Feature: Price · Google Data Studio: Free · Tableau: $15–$75/user/month
Feature: Visualization Depth · Google Data Studio: Basic charts + community · Tableau: Best in class
Feature: Data Sources · Google Data Studio: 1,000+ (cached/extracted) · Tableau: 100+ (live + extract)
Feature: Data Blending · Google Data Studio: Max 5 sources, JOIN only · Tableau: Unlimited, multiple join types
Feature: Data Prep · Google Data Studio: None · Tableau: Tableau Prep (visual ETL)
Feature: Data Modeling · Google Data Studio: Calculated fields · Tableau: LOD expressions, table calcs, parameters
Feature: Advanced Analytics · Google Data Studio: None · Tableau: R/Python, AI insights, forecasting
Feature: Governance · Google Data Studio: Basic (3 roles) · Tableau: Row-level security, project permissions
Feature: Collaboration · Google Data Studio: Real-time co-editing · Tableau: Server/Cloud publishing + commenting
Feature: Deployment · Google Data Studio: Browser only · Tableau: Desktop, Server, Cloud
Feature: Learning Curve · Google Data Studio: Low · Tableau: Medium-High
Feature: Mobile · Google Data Studio: Responsive web · Tableau: Native mobile app
Pricing Reality Check
For a team of 10 (2 report builders, 3 editors, 5 viewers):
Google Data Studio: $0/month
Tableau: 2 Creators ($150) + 3 Explorers ($126) + 5 Viewers ($75) = $351/month
Over a year, that is $0 vs $4,212. The cost gap is dramatic for small teams and becomes even wider when you add Tableau Server infrastructure costs.
However, Tableau delivers significantly more capability per dollar for teams that actually use its advanced features. If your analysts spend hours in Tableau exploring data and discovering insights, the ROI justifies the spend. If they are just building basic KPI dashboards, you are overpaying.
When to Choose Google Data Studio
- Budget is the primary constraint (or zero)
- Your data stack is Google-native
- Dashboards are primarily marketing KPIs and standard metrics
- Non-technical users need to self-serve
- Real-time collaboration on reports matters
- You want the fastest possible setup time
When to Choose Tableau
- Visualization quality and variety are top priorities
- Your team does exploratory analysis and ad-hoc data discovery
- You need LOD expressions and advanced calculations
- Data preparation with Tableau Prep is part of the workflow
- Multiple deployment options (on-prem, cloud, hybrid) are needed
- Budget supports premium BI tooling
A Better Alternative to Both: Graphed
Google Data Studio gives you free dashboards with limited depth. Tableau gives you visualization power at premium prices with months of training. Both require someone on your team to manually build, design, and maintain every report.
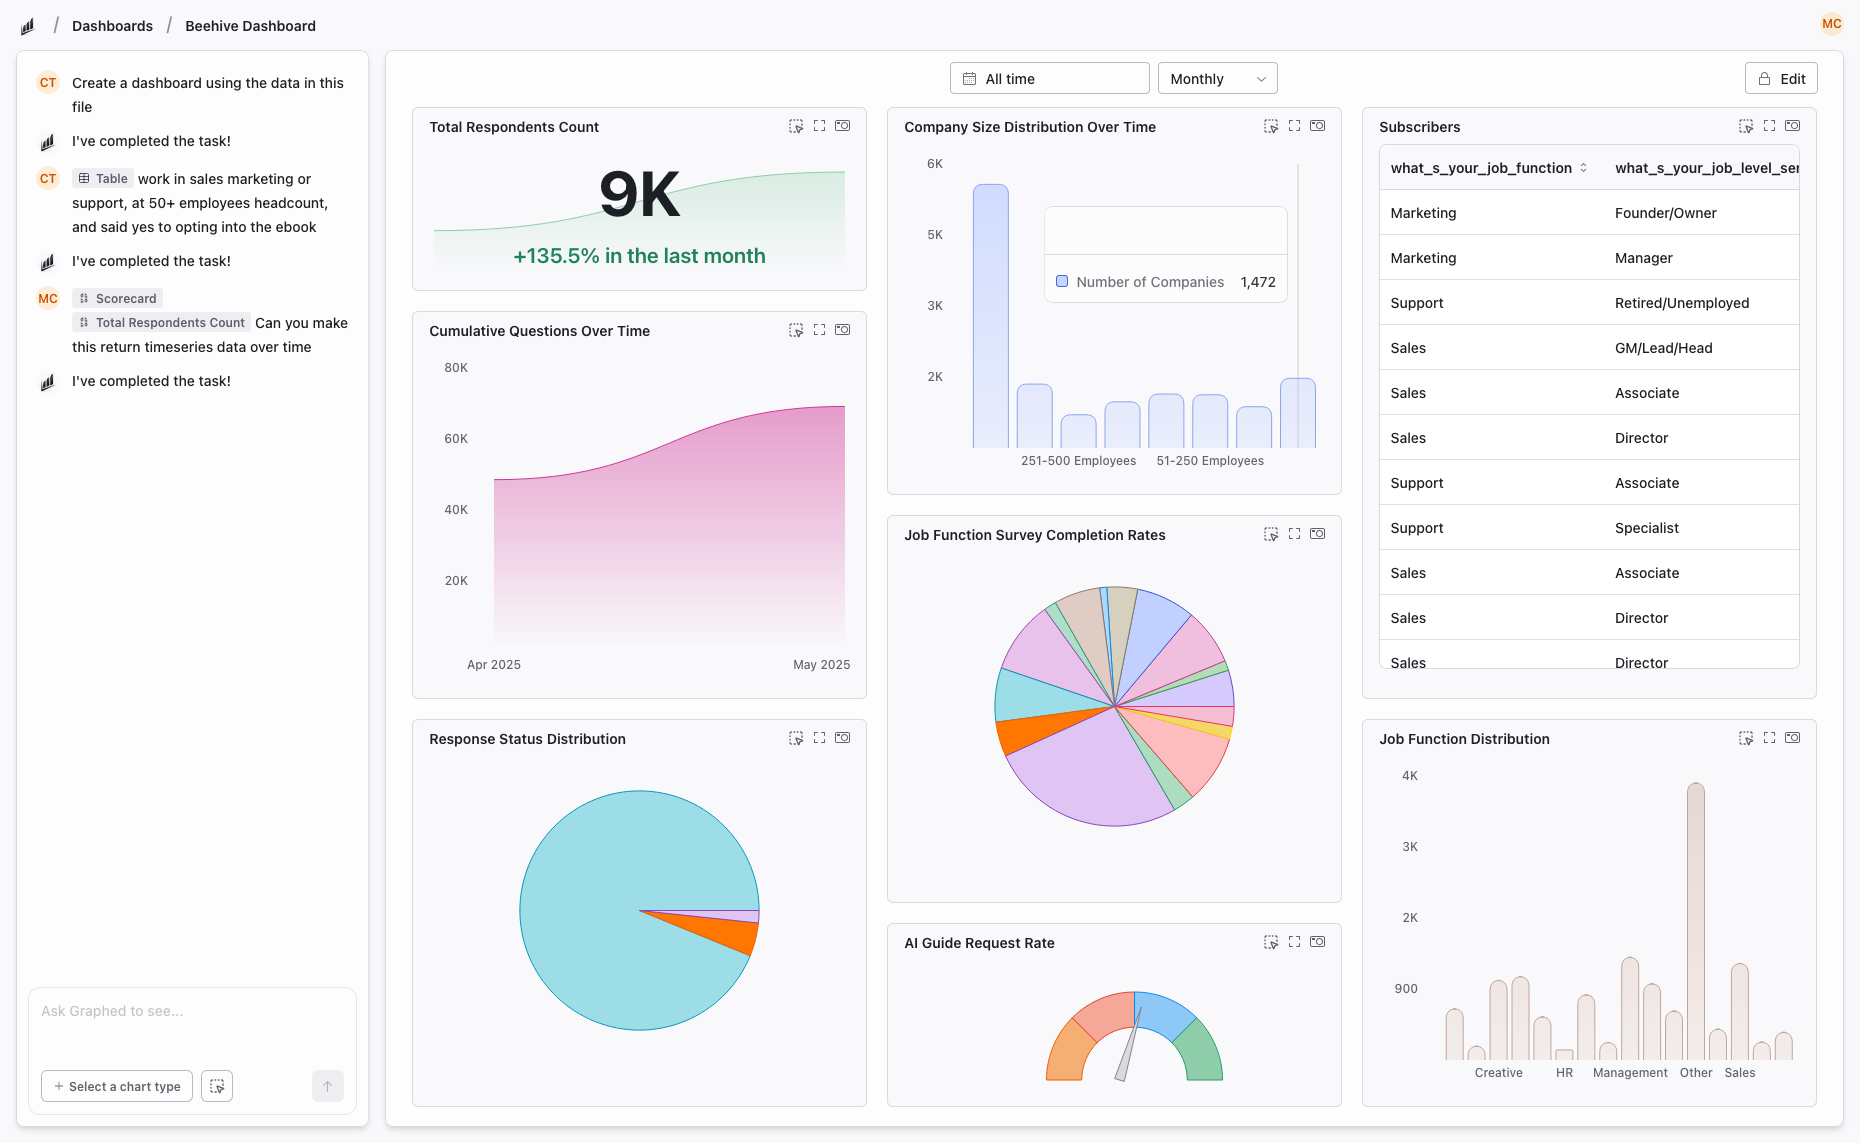
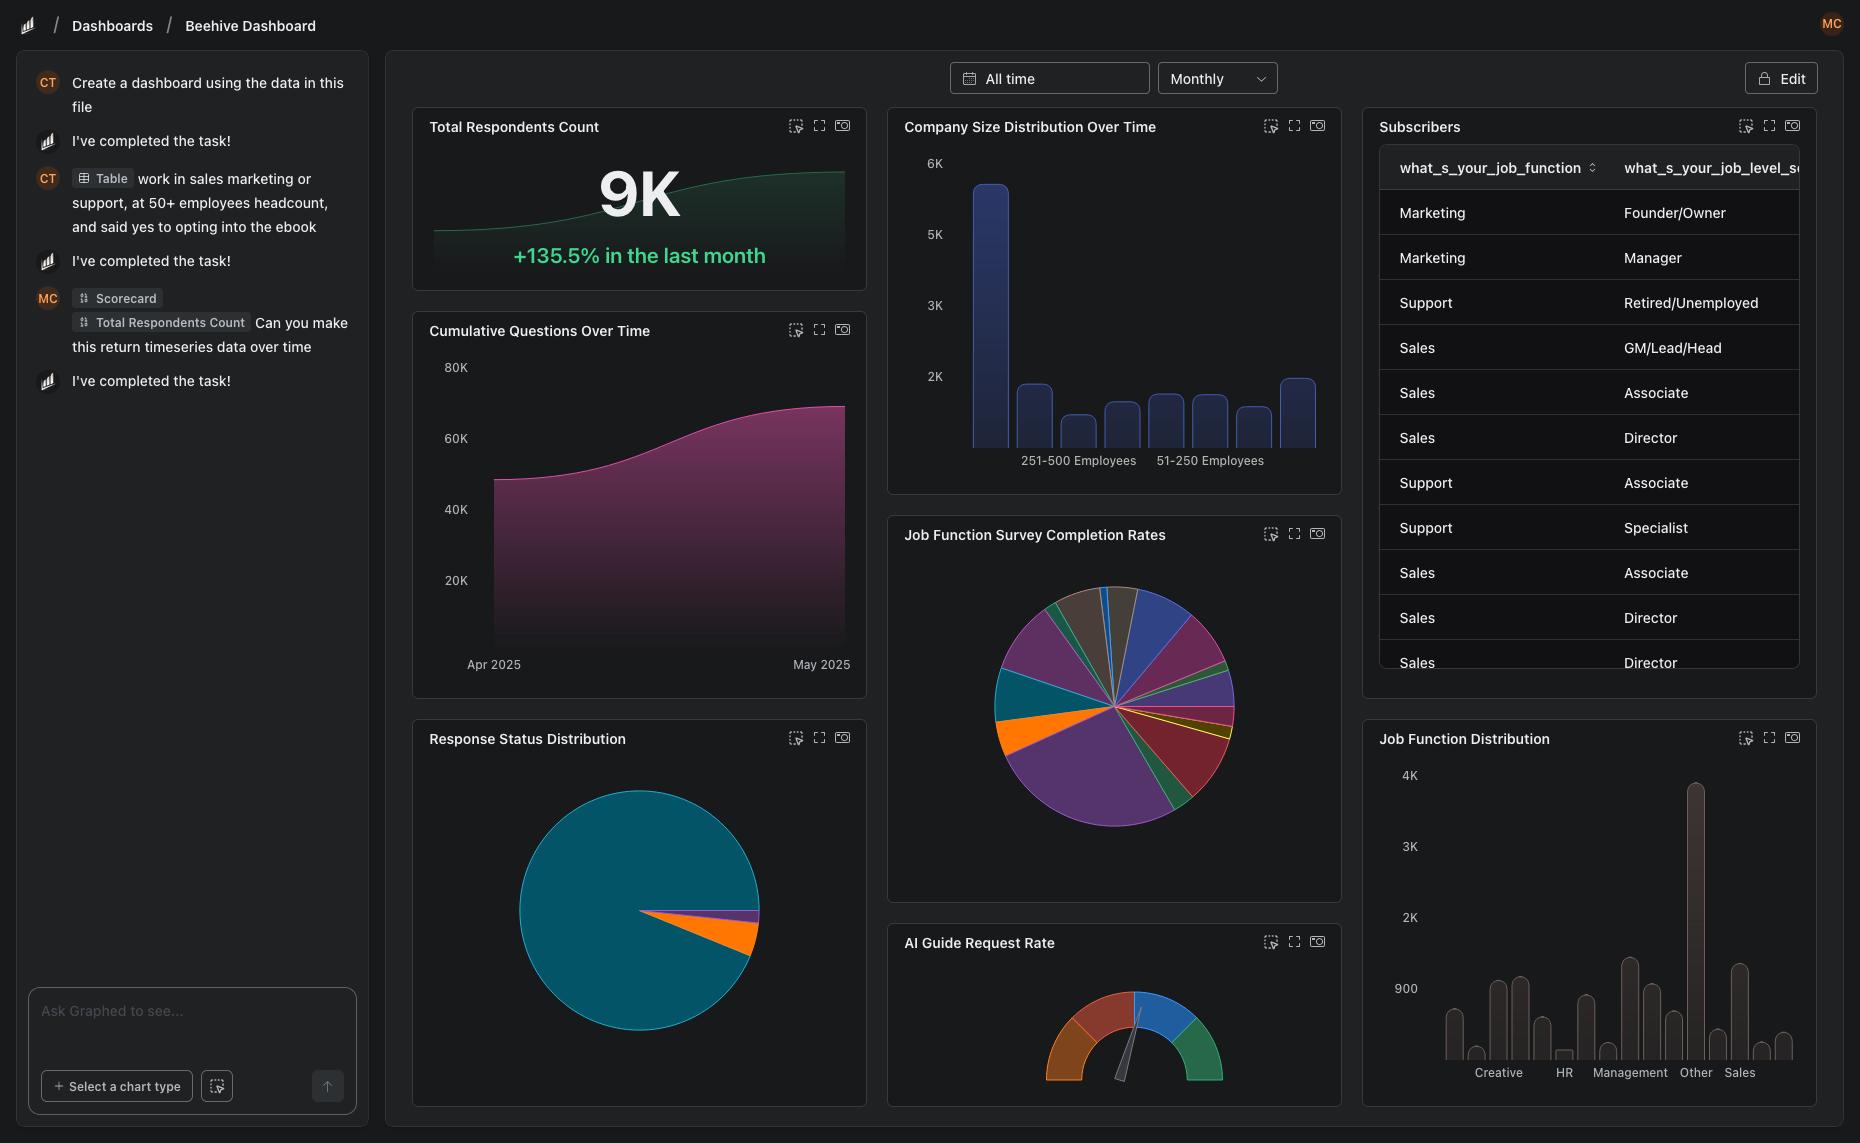
Graphed eliminates the manual building step. It is an AI data analyst that connects to 350+ data sources — GA4, Google Ads, Meta Ads, HubSpot, Shopify, Stripe, Salesforce, and more — and creates dashboards from plain English descriptions. No drag-and-drop canvas. No LOD expressions. Tell it what you need, and the AI writes the query, pulls the data, and renders the visualization.
Data syncs hourly. Setup takes 15 minutes. First dashboard in 24 hours. If you are choosing between "free but limited" and "powerful but expensive," Graphed gives you analytical depth without the manual work or the premium price tag.
The Bottom Line
Google Data Studio and Tableau serve different users at different budgets. Data Studio is the right choice for teams that need simple, free dashboards from Google data. Tableau is the right choice for data teams that need the best visualizations and can invest in training and licensing.
Neither tool is universally better. The decision depends on your budget, your team's technical skills, and whether you need basic reporting or deep exploratory analysis.
Related Articles
How to Create a Photo Album in Meta Business Suite
How to create a photo album in Meta Business Suite — step-by-step guide to organizing Facebook and Instagram photos into albums for your business page.
Is Google Analytics and Data Analytics the Same?
Is Google Analytics and data analytics the same? No — Google Analytics is one tool, data analytics is the broader discipline. Here is the difference.
What Database Does Tableau Use?
What database does Tableau use? Tableau connects to 100+ databases — it does not store data itself. Learn how live connections and extracts work.