Looker Studio vs BigQuery: What's the Difference and Do You Need Both?
Looker Studio and BigQuery are both Google Cloud products, but they solve completely different problems. BigQuery is a data warehouse — it stores and queries massive datasets. Looker Studio is a visualization tool — it turns data into charts and dashboards. Comparing them is like comparing a database to a spreadsheet — they work at different layers of the data stack.
That said, people search this question for a reason. If you are trying to figure out which one you need, how they work together, or whether one can replace the other, this guide breaks it down.
What BigQuery Does
BigQuery is Google's serverless, fully managed data warehouse. It is designed to store and query petabytes of data using SQL — fast. There is no infrastructure to manage, no indexes to build, and no servers to provision.
Core Capabilities
- Serverless SQL warehouse. Write SQL queries against massive datasets. BigQuery handles compute and storage automatically.
- Petabyte scale. Designed for enterprise-scale data. Queries that would take hours in traditional databases run in seconds.
- Native GA4 integration. Export raw GA4 event data to BigQuery for granular analysis beyond what GA4's interface shows.
- Machine learning (BigQuery ML). Build and deploy ML models — regression, classification, time series forecasting, clustering — using SQL syntax. No Python or R required.
- Streaming inserts. Ingest data in real-time for up-to-the-second dashboards.
- Federated queries. Query data in Cloud Storage, Bigtable, or Google Sheets without moving it into BigQuery.
- Pay-per-query pricing. You pay for the data your queries scan ($6.25 per TB) plus storage ($0.02/GB/month). Free tier includes 1 TB of queries and 10 GB of storage per month.
What BigQuery Does Not Do
- No visualization. BigQuery returns query results as tables. It does not create charts, dashboards, or reports.
- No drag-and-drop interface. You interact with BigQuery through SQL. There is no visual builder for non-technical users.
- No report sharing. You cannot send a BigQuery result as a recurring email dashboard to your CMO.
What Looker Studio Does
Looker Studio is a free, browser-based dashboard builder. It connects to data sources — including BigQuery — and lets you build interactive reports with drag-and-drop charts, filters, and scorecards.
Core Capabilities
- Visual dashboards. Drag charts, tables, and scorecards onto a canvas. No code required.
- 1,000+ data connectors. Native connectors for GA4, Google Ads, Sheets, BigQuery, and 1,000+ partner connectors for Meta Ads, HubSpot, Salesforce, and more.
- Real-time collaboration. Multiple editors simultaneously, Google Docs style.
- Scheduled delivery. Email dashboard snapshots on a schedule.
- Calculated fields. Create custom metrics within reports.
- Free. No license cost for the core product.
What Looker Studio Does Not Do
- No data storage. Looker Studio does not store data. It connects to external sources and caches results temporarily.
- No SQL querying. You cannot write raw SQL in Looker Studio (unless using a BigQuery connector with custom queries).
- No data transformation. Limited data blending (max 5 sources). No ETL, no complex joins, no data cleaning.
- No machine learning. No predictive models, no statistical analysis.
- No large-scale performance. Extracts and caches data, which slows down with complex or large datasets.
How They Work Together
The most common and powerful setup is using both:
- BigQuery stores and processes your data — raw GA4 events, CRM exports, ad platform data, Shopify orders, Stripe transactions. You use SQL to clean, transform, and aggregate it.
- Looker Studio visualizes the results — connect Looker Studio to BigQuery tables or views, then build dashboards that update automatically as new data flows in.
This is the standard Google Cloud analytics stack:
Data Sources → BigQuery (storage + SQL) → Looker Studio (dashboards)
Why This Combo Works
- BigQuery handles the heavy lifting — joins, aggregations, window functions, ML — that Looker Studio cannot do.
- Looker Studio provides the visual layer that BigQuery lacks.
- BigQuery eliminates Looker Studio's performance problems. Instead of Looker Studio extracting and caching data from raw sources, it queries pre-aggregated BigQuery tables that return results instantly.
- Custom SQL in the BigQuery connector lets you bypass Looker Studio's 5-source blending limit. Write a single SQL query that joins 20 tables in BigQuery, then connect Looker Studio to that result.
The Workflow in Practice
A marketing analytics example:
- GA4 exports raw events to BigQuery (free, native integration)
- Google Ads, Meta Ads, and HubSpot data lands in BigQuery via Fivetran, Stitch, or manual CSV uploads
- SQL queries in BigQuery create summary tables: daily ad spend by channel, conversion rates by source, revenue by campaign
- Looker Studio connects to those BigQuery summary tables
- Dashboard shows unified marketing performance — updated hourly or daily depending on sync schedule
Can One Replace the Other?
Can BigQuery replace Looker Studio? No. BigQuery has no visualization capabilities. You need a frontend tool to turn query results into charts, dashboards, and shareable reports.
Can Looker Studio replace BigQuery? For small datasets from Google-native sources, yes — Looker Studio can connect directly to GA4, Sheets, and Google Ads without BigQuery. But the moment you need SQL transformations, cross-source joins beyond 5 tables, ML models, or performance on large datasets, you need BigQuery (or another warehouse).
When You Need BigQuery
- You are working with GA4 event-level data and need granular analysis beyond the GA4 interface
- You have data from multiple sources that need to be joined and transformed with SQL
- Your datasets are large enough to cause Looker Studio performance issues
- You need machine learning models (churn prediction, forecasting, segmentation)
- You want a single source of truth where all your data lives, cleaned and structured
When Looker Studio Alone Is Enough
- Your data comes from one or two Google sources (GA4 + Google Ads)
- Datasets are small enough that Looker Studio's caching does not cause delays
- You need simple KPI dashboards without complex transformations
- Your team does not have SQL skills
When Neither Tool Is Enough
Even with BigQuery and Looker Studio working together, you still face:
- Manual dashboard building. Every chart in Looker Studio is hand-built. When business questions change, someone has to rebuild reports.
- SQL dependency. BigQuery requires SQL skills to create the tables and views that feed Looker Studio. Non-technical teams cannot self-serve.
- Maintenance overhead. SQL queries break when schemas change. Looker Studio connectors need refreshing. Scheduled deliveries fail silently.
Skip the Pipeline — Try Graphed
If you are building a BigQuery + Looker Studio stack because you need cross-source analytics and visual dashboards, there is a path that does not require SQL or manual dashboard building.
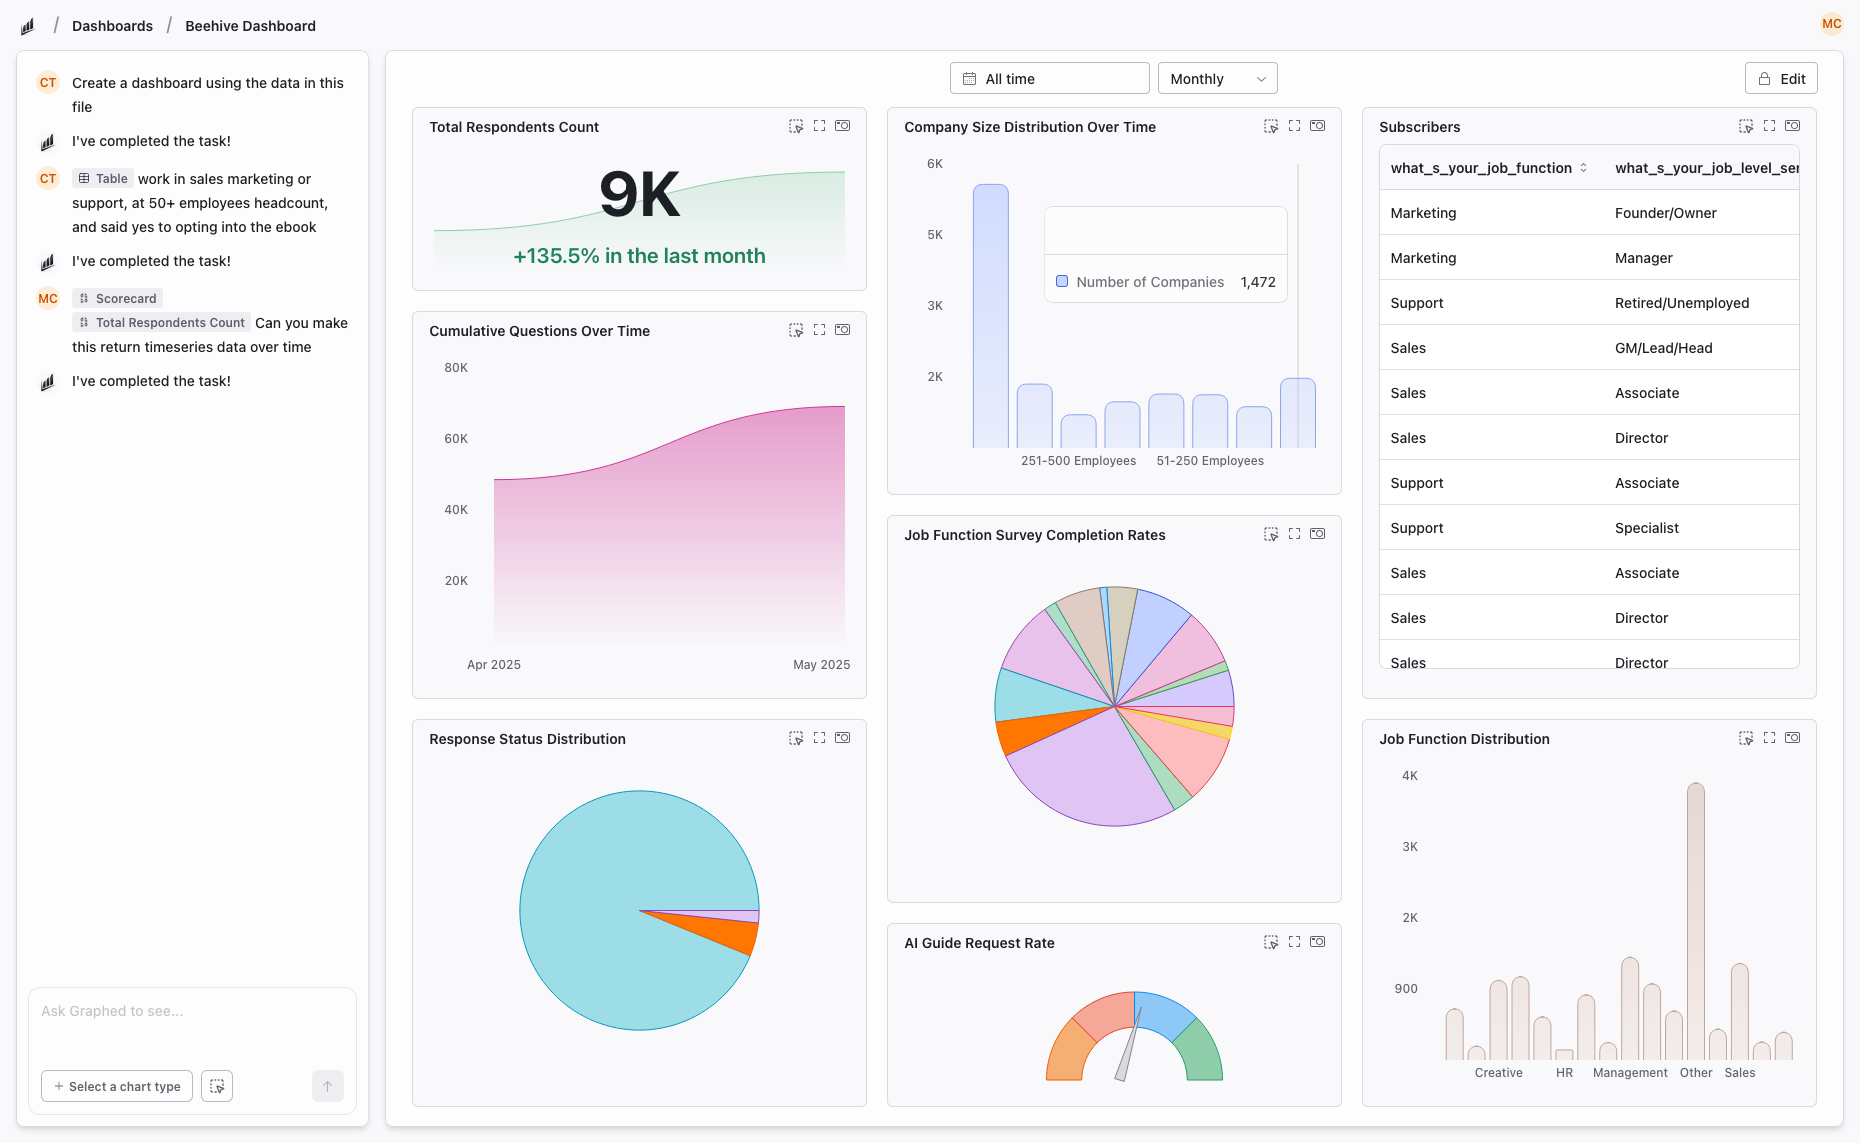
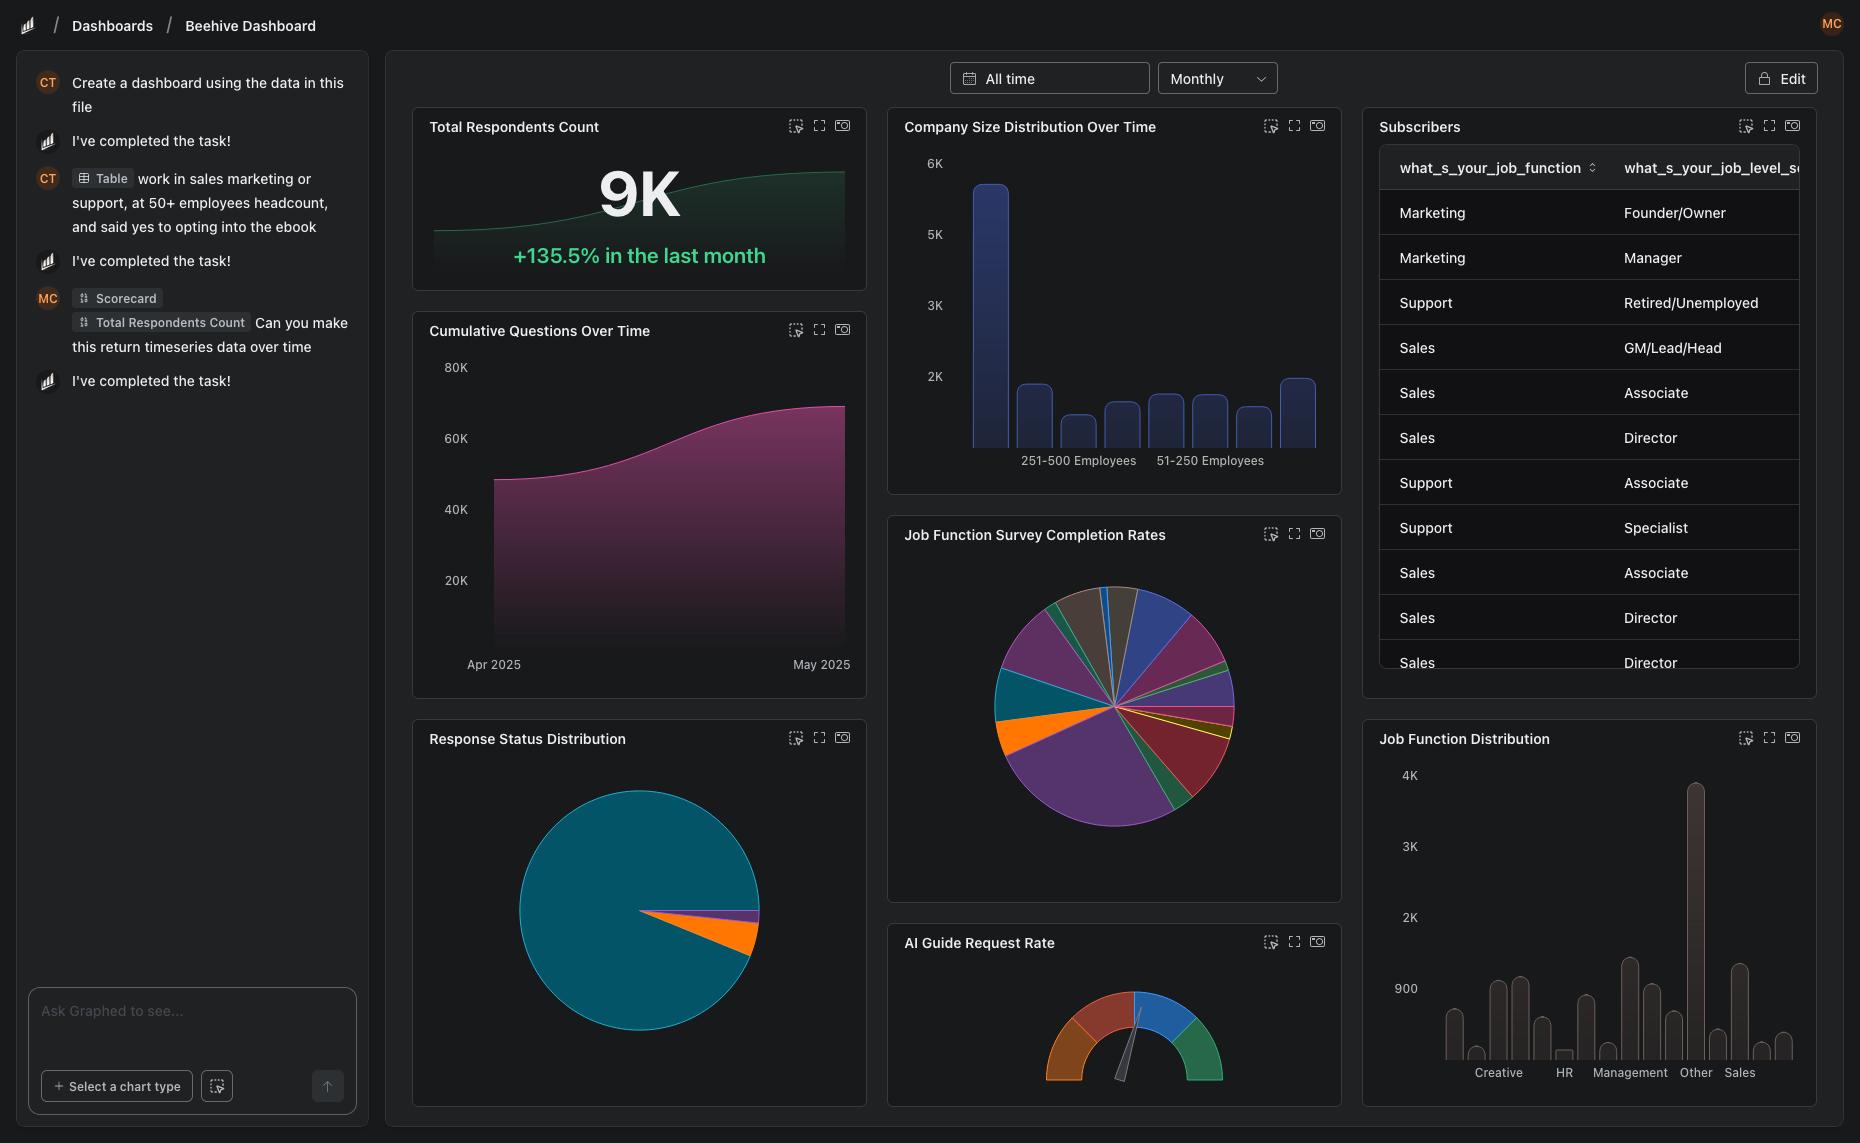
Graphed is an AI data analyst that connects directly to your data sources — GA4, Google Ads, Meta Ads, HubSpot, Shopify, Stripe, Salesforce, and 350+ more — ingests the data into its own warehouse, and builds dashboards from natural language prompts. No SQL. No drag-and-drop. Tell it what you want to see, and the AI handles the rest.
Data syncs hourly. Setup takes 15 minutes (OAuth your sources). First dashboard within 24 hours. If you were about to spend weeks building a BigQuery + Looker Studio pipeline, Graphed gets you to the same outcome in a fraction of the time.
The Bottom Line
BigQuery and Looker Studio are not competitors — they are complementary layers of Google's analytics stack. BigQuery handles storage, SQL, and heavy computation. Looker Studio handles visualization and sharing. Most serious analytics setups use both.
The question is not which one to choose. It is whether building and maintaining the pipeline between them is worth your team's time — or whether an AI-powered tool can get you the same answers faster.
Related Articles
How to Create a Photo Album in Meta Business Suite
How to create a photo album in Meta Business Suite — step-by-step guide to organizing Facebook and Instagram photos into albums for your business page.
Is Google Analytics and Data Analytics the Same?
Is Google Analytics and data analytics the same? No — Google Analytics is one tool, data analytics is the broader discipline. Here is the difference.
What Database Does Tableau Use?
What database does Tableau use? Tableau connects to 100+ databases — it does not store data itself. Learn how live connections and extracts work.