Looker Studio vs Databox: Which Dashboard Tool Is Right for Your Team?
Looker Studio is free and flexible. Databox is paid and polished. Both build marketing dashboards, but they take very different approaches. Looker Studio gives you a blank canvas. Databox gives you pre-built templates and a mobile-first experience.
This guide compares the two on features, pricing, data sources, and ease of use so you can pick the right one without signing up for both.
Looker Studio Overview
Google's free dashboard builder with 1,000+ data connectors and a drag-and-drop editor. Best for teams in the Google ecosystem that want maximum flexibility without spending money.
Price: Free. Pro at $9/user/month.
Strengths:
- Free with full functionality
- 1,000+ connectors (native Google + paid partner connectors)
- Complete layout customization — total control over design
- Real-time collaboration
- Community visualizations extend chart types
- BigQuery integration for large datasets
Weaknesses:
- Blank canvas requires building everything from scratch
- 5-source data blending limit
- Non-Google connectors cost $39–$200/month each
- No goal tracking or benchmarking
- No native mobile app optimized for dashboards
- Basic governance
Databox Overview
Databox is a KPI tracking and dashboard platform focused on marketing and sales metrics. It emphasizes pre-built templates, mobile dashboards, and goal tracking rather than custom visualization.
Price: Free for 3 sources and 3 dashboards. Starter: $59/month. Professional: $169/month. Performer: $399/month.
Strengths:
- Pre-built templates. Hundreds of ready-made dashboard templates for GA4, Google Ads, HubSpot, Facebook Ads, and more. Connect a source and get a working dashboard in minutes — no building required.
- Mobile-first. Purpose-built mobile app with push notifications, designed for checking KPIs on the go.
- Goal tracking. Set targets for any metric and track progress with visual indicators. Alerts when metrics go off track.
- Benchmarking. Compare your metrics against anonymous industry benchmarks. See how your Google Ads CTR stacks up against similar companies.
- 130+ native connectors. Covers major marketing, sales, and finance platforms. All connectors included — no per-connector fees.
- DataWalls and scorecards. Purpose-built for TV dashboard displays and team scorecards.
- Simple setup. OAuth connect, pick a template, done. Fastest time-to-dashboard of any BI tool.
Weaknesses:
- Free plan is very limited. 3 data sources, 3 dashboards, limited history.
- Less customization. Cannot build pixel-perfect custom layouts like Looker Studio. Templates are polished but constrained.
- Fewer connectors than Looker Studio. 130 vs 1,000+. Niche sources may not be covered.
- No data blending. Cannot combine data from multiple sources into a single chart the way Looker Studio can.
- No SQL or advanced calculations. Limited to pre-built metrics and simple formulas.
- Gets expensive. $169/month for Professional with 50 sources. $399/month for Performer. Costs add up faster than expected.
Feature Comparison
Feature: Price · Looker Studio: Free (Pro $9/user) · Databox: Free (limited); $59–$399/mo
Feature: Connectors · Looker Studio: 1,000+ (some paid) · Databox: 130+ (all included)
Feature: Templates · Looker Studio: Community templates · Databox: Hundreds of pre-built templates
Feature: Custom Layouts · Looker Studio: Full blank-canvas control · Databox: Template-based, limited customization
Feature: Data Blending · Looker Studio: Up to 5 sources · Databox: Not available
Feature: Goal Tracking · Looker Studio: Not built in · Databox: Yes — visual targets and alerts
Feature: Benchmarking · Looker Studio: Not available · Databox: Industry benchmark comparisons
Feature: Mobile App · Looker Studio: Responsive web · Databox: Native mobile app with push
Feature: TV Dashboards · Looker Studio: Manual setup · Databox: DataWalls (purpose-built)
Feature: Collaboration · Looker Studio: Real-time co-editing · Databox: Dashboard sharing
Feature: Learning Curve · Looker Studio: Low-Medium · Databox: Very Low
Feature: Governance · Looker Studio: Basic · Databox: Basic
When to Choose Looker Studio
- Budget must be zero
- You need to combine data from 2–5 sources in single charts
- Full design control over dashboard layouts is important
- Your data lives primarily in Google ecosystem
- You have the time and skill to build dashboards from scratch
- BigQuery is part of your data stack
When to Choose Databox
- You want dashboards in minutes, not hours
- Mobile KPI checking is a daily workflow
- Goal tracking and progress monitoring matter
- You want industry benchmarks for context
- TV dashboards for the office or team meetings
- You prefer templates over blank-canvas building
Why Teams Choose Graphed Over Both
Looker Studio gives you a blank canvas that takes hours to fill. Databox gives you templates that look great but cannot blend data or handle complex analysis. Both require you to maintain dashboards as your business evolves.
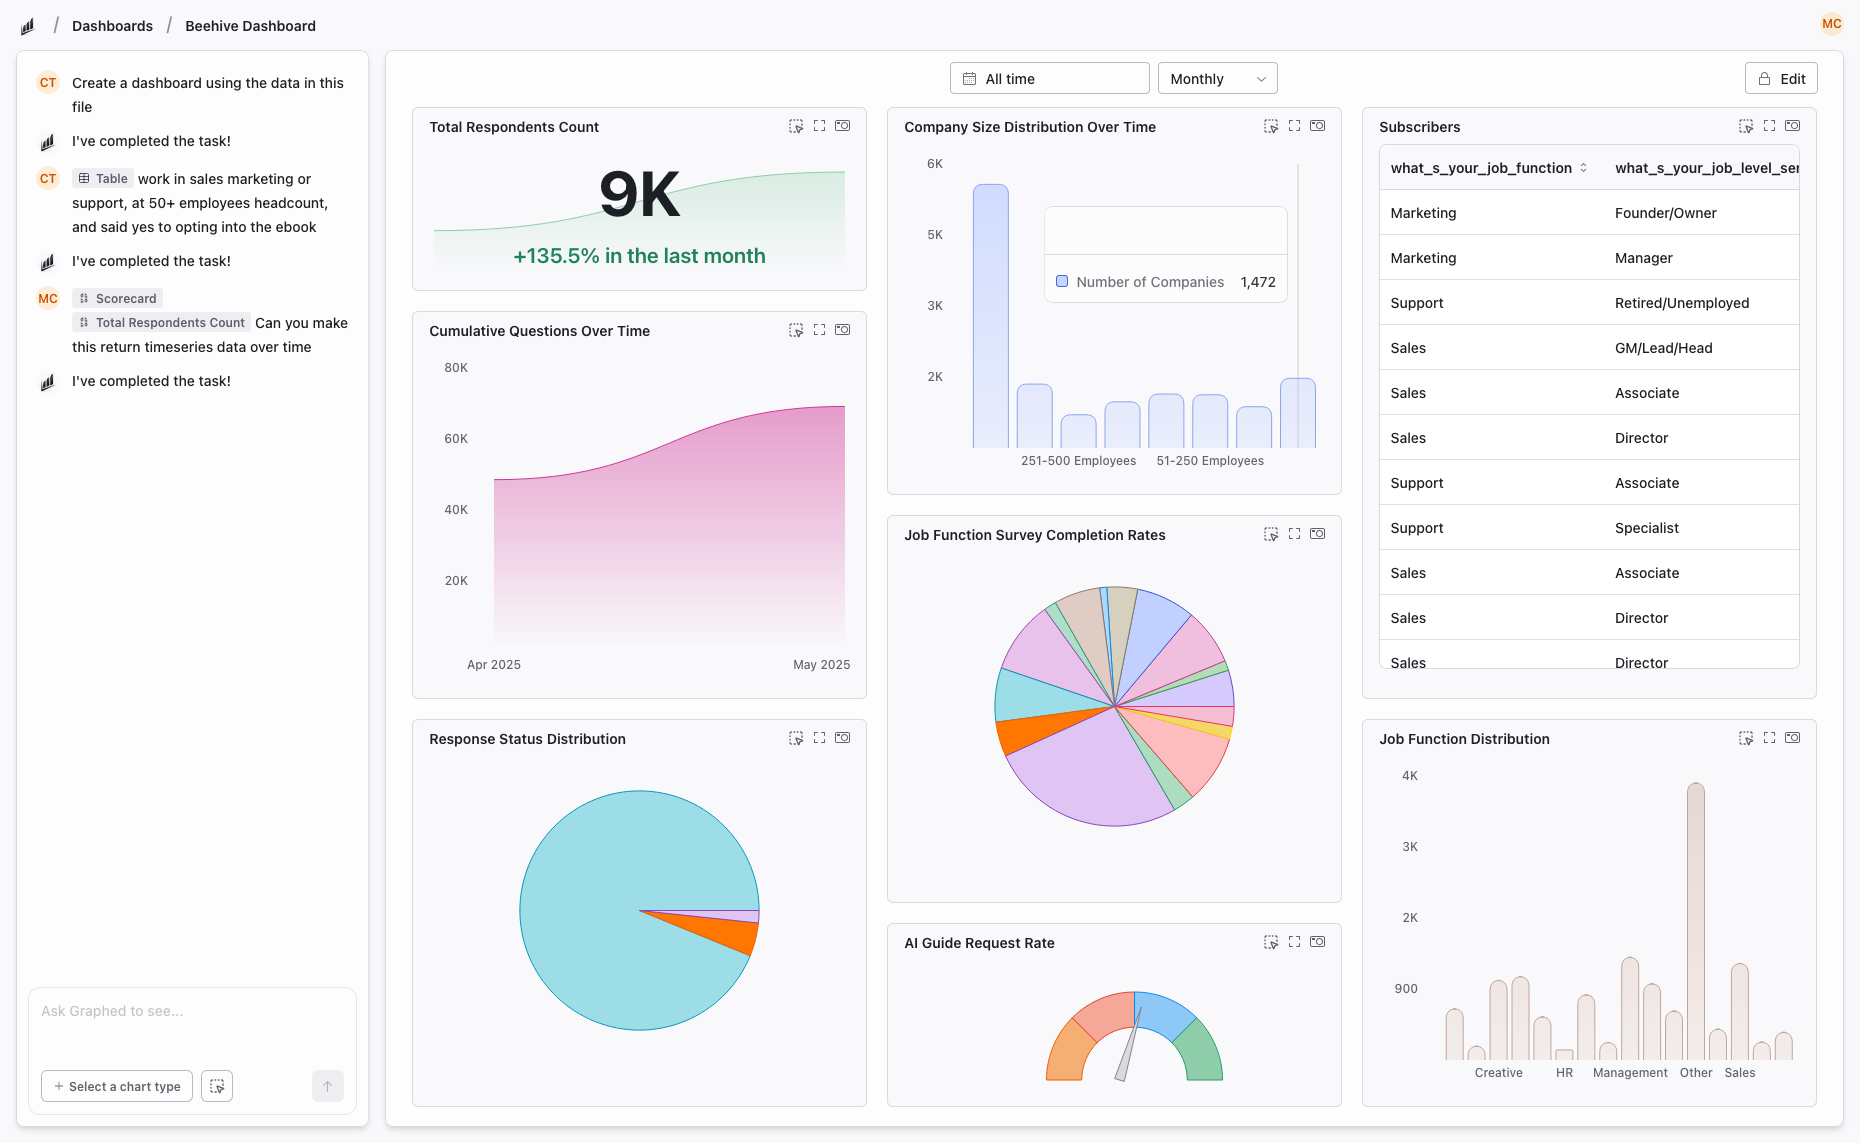
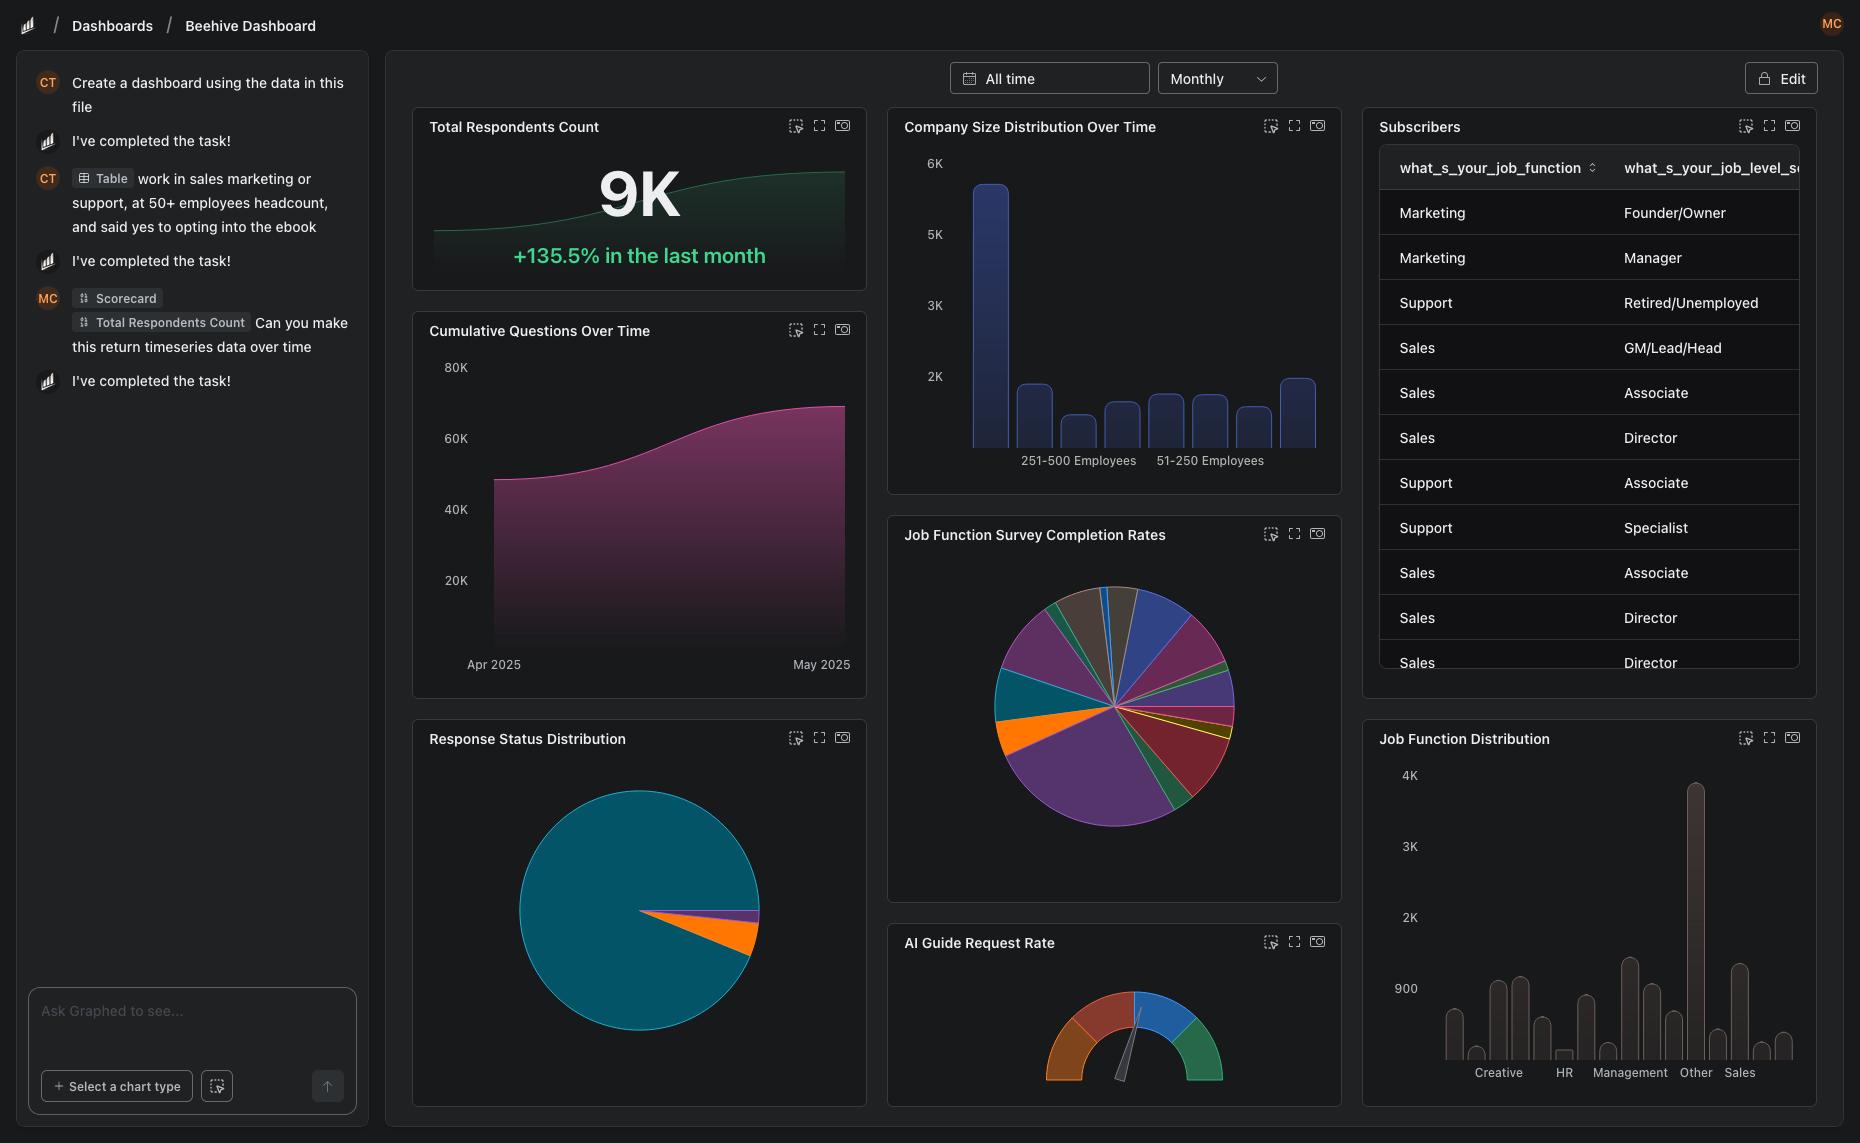
Graphed is an AI data analyst that connects to 350+ data sources — including everything Databox and Looker Studio connect to — and builds dashboards from plain English prompts. No templates to browse. No canvas to design. Tell it what you want to see, and the AI creates it.
Data syncs hourly. Setup takes 15 minutes. First dashboard in 24 hours. If you want the speed of Databox's templates with the flexibility of Looker Studio's custom analysis — without the manual work of either — Graphed delivers both.
The Bottom Line
Looker Studio wins on flexibility and cost. Databox wins on speed, mobile, and goal tracking. They serve different workflows: Looker Studio for custom analysis, Databox for quick KPI monitoring. Your choice depends on whether you value customization or speed to dashboard.
Related Articles
How to Create a Photo Album in Meta Business Suite
How to create a photo album in Meta Business Suite — step-by-step guide to organizing Facebook and Instagram photos into albums for your business page.
Is Google Analytics and Data Analytics the Same?
Is Google Analytics and data analytics the same? No — Google Analytics is one tool, data analytics is the broader discipline. Here is the difference.
What Database Does Tableau Use?
What database does Tableau use? Tableau connects to 100+ databases — it does not store data itself. Learn how live connections and extracts work.