Looker Studio vs Power BI vs Tableau: Which BI Tool Wins in 2026?
Three tools, three very different philosophies. Looker Studio is free and simple. Power BI is powerful and Microsoft-native. Tableau has the best visualizations in the business. Every comparison article ranks them differently depending on who is writing — so here is an honest breakdown based on what each tool actually does, who it is for, and where it falls apart.
The Quick Answer
- Looker Studio if you want free dashboards, your data is in Google's ecosystem, and you do not need advanced analytics.
- Power BI if your organization runs on Microsoft, you need DAX for complex modeling, and you have analysts who can handle the learning curve.
- Tableau if visualization quality is non-negotiable, you have the budget, and your team does exploratory analysis.
For everyone else, keep reading.
Looker Studio
What it is: Google's free, browser-based reporting tool (formerly Google Data Studio). Drag-and-drop dashboards with 1,000+ data connectors.
Price: Free. Pro at $9/user/month.
Strengths:
- Completely free for full functionality
- Native Google ecosystem connectors (GA4, Ads, Sheets, BigQuery, Search Console)
- Real-time collaboration like Google Docs
- Lowest learning curve of the three — anyone can build a report in minutes
- 1,000+ partner connectors for non-Google sources
Weaknesses:
- Data blending limited to 5 sources (JOIN only, no UNION)
- No real data modeling — calculated fields are report-specific
- Performance degrades with large datasets (extracts and caches data)
- Basic governance (Owner/Editor/Viewer)
- Limited chart types compared to Tableau
- No advanced analytics, no R/Python, no predictive modeling
Best for: Marketing teams, startups, small businesses, and anyone who needs quick Google ecosystem dashboards without spending money.
Power BI
What it is: Microsoft's BI platform with desktop authoring, cloud publishing, and deep Azure integration. The most feature-rich option per dollar.
Price: Free desktop (Windows only). Pro: $10/user/month. Premium: $20/user/month or $4,995/month capacity.
Strengths:
- DAX formula language for complex calculations and time intelligence
- Power Query for built-in data transformation (ETL without external tools)
- DirectQuery for real-time warehouse queries on large datasets
- Row-level security, Azure AD, encryption, audit logs
- AppSource marketplace with hundreds of custom visuals
- R and Python integration for statistical analysis
- Paginated reports for pixel-perfect compliance documents
- Best price-to-power ratio of any paid BI tool
Weaknesses:
- Desktop app is Windows-only (Mac users need workarounds)
- DAX learning curve is notoriously steep
- Interface can overwhelm new users
- Microsoft ecosystem lock-in (works best with Azure, SQL Server, Excel)
- Premium pricing scales fast in large deployments
Best for: Data analysts, finance teams, and enterprises on the Microsoft stack that need advanced data modeling without Tableau-level pricing.
Tableau
What it is: The industry standard for data visualization, now owned by Salesforce. Best-in-class charting with exploratory analysis capabilities.
Price: Creator: $75/user/month. Explorer: $42/user/month. Viewer: $15/user/month.
Strengths:
- Deepest visualization library of any BI tool (treemaps, heatmaps, box plots, waterfall, sankey, Gantt)
- Level of Detail (LOD) expressions for multi-granularity calculations
- Intuitive drag-and-drop exploration — suggest best chart type automatically
- Tableau Prep for visual data cleaning and shaping
- Deployment flexibility (Desktop, Server, Cloud)
- AI features (Ask Data, Explain Data, Einstein Discovery)
- Largest community, most training resources, Tableau Public for portfolios
Weaknesses:
- Most expensive of the three ($75/user for full authoring)
- Requires separate ETL infrastructure for production use
- Desktop app required for full authoring (Windows/Mac, no Linux)
- Learning curve for LOD expressions and advanced calculations
- Salesforce acquisition has shifted product direction
Best for: Data teams that prioritize visualization quality, exploratory analysis, and have the budget and skills to maximize the platform.
Side-by-Side Comparison
Feature: Price · Looker Studio: Free (Pro $9/user) · Power BI: $10–$20/user/mo · Tableau: $15–$75/user/mo
Feature: Data Modeling · Looker Studio: Calculated fields · Power BI: DAX + Power Query · Tableau: LOD expressions + calcs
Feature: Data Sources · Looker Studio: 1,000+ (cached) · Power BI: 200+ (DirectQuery + import) · Tableau: 100+ (live + extract)
Feature: Visualization · Looker Studio: Basic + community · Power BI: Extensive + AppSource · Tableau: Best in class
Feature: ETL/Data Prep · Looker Studio: None · Power BI: Power Query (built-in) · Tableau: Tableau Prep
Feature: Advanced Analytics · Looker Studio: None · Power BI: R/Python, AI insights · Tableau: Ask Data, Einstein
Feature: Governance · Looker Studio: Basic · Power BI: Row-level security, Azure AD · Tableau: Row-level security, projects
Feature: Collaboration · Looker Studio: Real-time co-editing · Power BI: Workspaces + Teams · Tableau: Server/Cloud publishing
Feature: Embedded Analytics · Looker Studio: Basic iframe · Power BI: REST API, white-label · Tableau: Embedded Analytics API
Feature: Platform · Looker Studio: Browser (any OS) · Power BI: Windows desktop + web · Tableau: Desktop (Win/Mac) + web
Feature: Learning Curve · Looker Studio: Low · Power BI: High · Tableau: Medium-High
Feature: Best Ecosystem · Looker Studio: Google · Power BI: Microsoft · Tableau: Salesforce
Cost Comparison for a 20-Person Team
Assuming 3 report builders, 7 editors, and 10 viewers:
Looker Studio:
- Free tier: $0/month
- Pro tier: $180/month (20 users x $9)
- Third-party connectors: $100–$500/month
Power BI:
- Pro: $200/month (20 users x $10)
- Premium Per User: $400/month (20 users x $20)
- Third-party connectors: $100–$300/month
Tableau:
- 3 Creators ($75) + 7 Explorers ($42) + 10 Viewers ($15): $669/month
- Tableau Server/Cloud: additional infrastructure costs
Looker Studio wins on cost by a wide margin. Power BI offers the best value for advanced features. Tableau is the premium option.
Decision Framework
Choose Looker Studio when:
- Budget is zero or near-zero
- Google ecosystem is your primary data stack
- Reports are straightforward (marketing KPIs, traffic dashboards)
- Non-technical users need to self-serve
- Speed of setup matters more than analytical depth
Choose Power BI when:
- Your organization runs on Microsoft (Azure, SQL Server, Excel, Teams)
- Complex data modeling with DAX is a requirement
- You need built-in ETL via Power Query
- Row-level security and enterprise governance are non-negotiable
- Budget allows $10–$20/user but not Tableau-level pricing
Choose Tableau when:
- Visualization quality and variety are the top priority
- Your team does exploratory analysis and ad-hoc discovery
- You can invest in training for LOD expressions and Tableau Prep
- Budget supports $42–$75/user/month
- Deployment flexibility (on-prem, cloud, hybrid) matters
Why Teams Are Choosing Graphed Instead
All three tools share the same fundamental model: someone on your team manually builds dashboards, writes formulas, and maintains reports. The tools differ in how powerful and expensive that manual work is — but it is always manual.
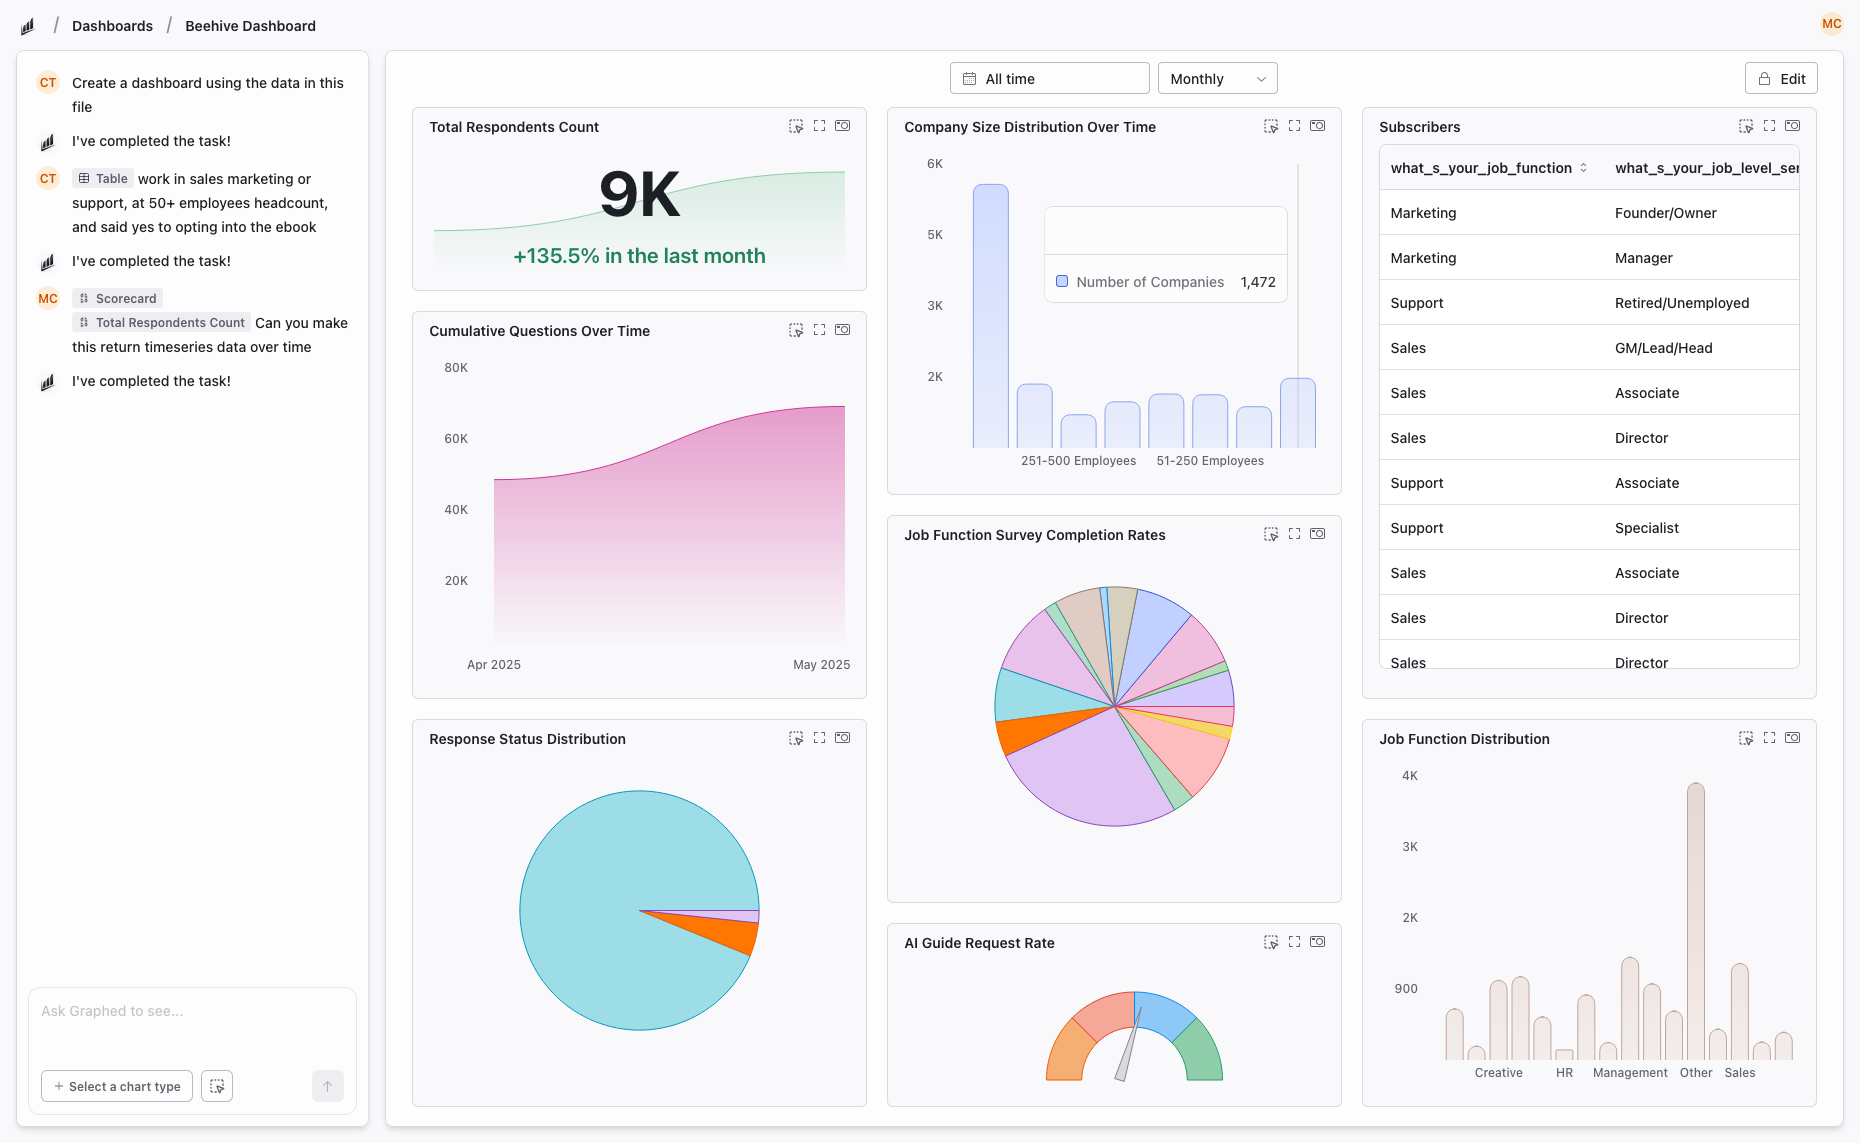
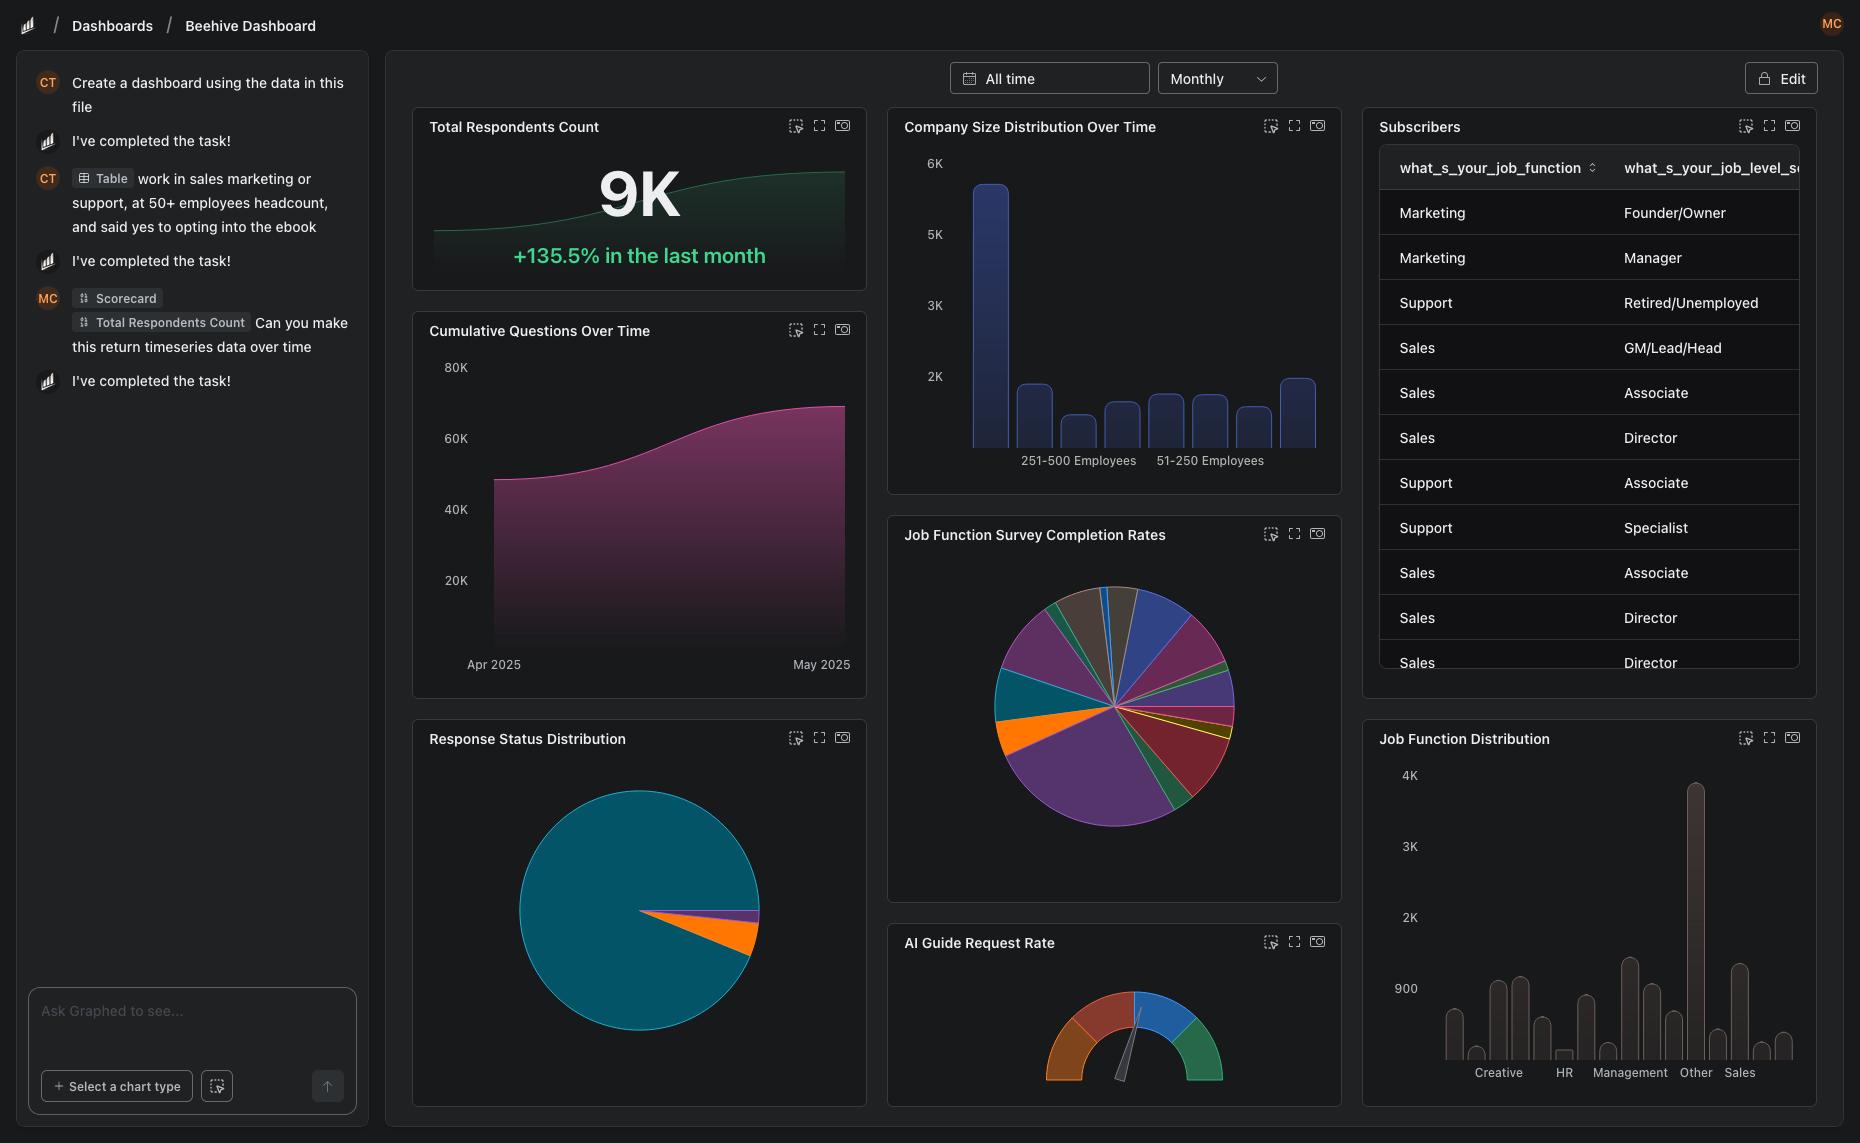
Graphed eliminates the building step entirely. It is an AI data analyst that connects to your live data — GA4, Google Ads, Meta Ads, HubSpot, Shopify, Stripe, Salesforce, and 350+ more — and creates dashboards from natural language. Ask it a question, and the AI writes the query, pulls the data, and renders the visualization. No DAX. No LOD expressions. No drag-and-drop canvas.
Data syncs hourly. OAuth setup takes 15 minutes. First dashboard in 24 hours. If you are comparing three tools that all require manual dashboard building, you might be asking the wrong question.
The Bottom Line
There is no single "best" tool. Looker Studio wins on cost. Power BI wins on data modeling per dollar. Tableau wins on visualization. Your decision should be based on your team's ecosystem (Google vs Microsoft vs Salesforce), technical skills, budget, and whether basic reporting or deep analysis is the priority.
Or you can skip the debate and let AI handle it.
Related Articles
How to Create a Photo Album in Meta Business Suite
How to create a photo album in Meta Business Suite — step-by-step guide to organizing Facebook and Instagram photos into albums for your business page.
Is Google Analytics and Data Analytics the Same?
Is Google Analytics and data analytics the same? No — Google Analytics is one tool, data analytics is the broader discipline. Here is the difference.
What Database Does Tableau Use?
What database does Tableau use? Tableau connects to 100+ databases — it does not store data itself. Learn how live connections and extracts work.