Looker Studio vs Amazon QuickSight: Google's Free Tool vs AWS's BI Platform
Looker Studio and Amazon QuickSight are cloud-native BI tools from competing ecosystems. Looker Studio is Google's free dashboard builder. QuickSight is AWS's pay-per-session analytics platform. If your data lives in one cloud, the choice is often made for you — but not always.
This comparison covers pricing, data integration, visualization, analytics capabilities, and the real differences that affect daily use.
Looker Studio Overview
Looker Studio (formerly Google Data Studio) is a free, browser-based reporting tool. It connects to 1,000+ data sources with native Google ecosystem integration and lets anyone build dashboards with a drag-and-drop interface.
Price: Free. Pro at $9/user/month.
Key Strengths:
- Completely free core product
- Native connectors for GA4, Google Ads, Sheets, BigQuery, Search Console
- 1,000+ partner connectors
- Real-time collaboration (Google Docs style)
- Low learning curve — non-technical users can build reports immediately
Key Weaknesses:
- 5-source data blending limit
- No data modeling or semantic layer
- Performance degrades with large datasets
- Basic governance (Owner/Editor/Viewer)
- No advanced analytics or ML capabilities
Amazon QuickSight Overview
QuickSight is AWS's serverless BI service. It is tightly integrated with the AWS data stack — Redshift, S3, Athena, RDS, Aurora — and uses a unique pay-per-session pricing model that can be cheaper than per-seat licensing for organizations with many casual viewers.
Price: Standard: $3/reader/session (up to $5/month cap per reader). Enterprise Author: $18/user/month. Enterprise Reader: $0.30/session (up to $5/month cap).
Key Strengths:
- SPICE engine. In-memory calculation engine that caches data for fast dashboards. Included storage starts at 10 GB per user, scales to petabytes.
- Pay-per-session pricing. Readers pay only when they view a dashboard ($0.30/session, capped at $5/month). For organizations with hundreds of viewers who check dashboards occasionally, this is dramatically cheaper than per-seat tools.
- AWS native. Direct connectors to Redshift, S3, Athena, RDS, Aurora, and other AWS services. If your data warehouse is on AWS, setup is seamless.
- ML Insights. Built-in anomaly detection, forecasting, and natural language narratives. QuickSight Q enables natural language queries.
- Embedded analytics. White-label dashboards in your own applications with multi-tenant support, row-level security, and API access.
- Paginated reports. Pixel-perfect, printable reports for compliance and finance.
Key Weaknesses:
- Limited non-AWS connectors. Connecting to Google Analytics, Google Ads, or Meta Ads requires workarounds (often piping data through S3 first).
- SPICE refresh limits. Data refreshes are scheduled, not real-time. Enterprise users get more frequent refreshes but it is not instant.
- Visualization options. Decent but fewer chart types and less customization than Tableau or even Looker Studio's community visualizations.
- Smaller community. Less documentation, fewer templates, and a smaller user community than Looker Studio, Power BI, or Tableau.
- Learning curve. More complex than Looker Studio, especially for users unfamiliar with AWS concepts.
Feature Comparison
Feature: Price · Looker Studio: Free (Pro $9/user) · Amazon QuickSight: $0.30–$18/user/session or month
Feature: Best Ecosystem · Looker Studio: Google (GA4, Ads, BigQuery) · Amazon QuickSight: AWS (Redshift, S3, Athena, RDS)
Feature: Data Engine · Looker Studio: Extract and cache · Amazon QuickSight: SPICE (in-memory)
Feature: Data Sources · Looker Studio: 1,000+ connectors · Amazon QuickSight: 20+ native (AWS-heavy)
Feature: ML/AI · Looker Studio: Gemini (Pro only) · Amazon QuickSight: Anomaly detection, forecasting, Q
Feature: Embedded Analytics · Looker Studio: Basic iframe · Amazon QuickSight: Full white-label, multi-tenant
Feature: Governance · Looker Studio: Basic · Amazon QuickSight: Row-level security, column-level security
Feature: Paginated Reports · Looker Studio: No · Amazon QuickSight: Yes
Feature: Collaboration · Looker Studio: Real-time co-editing · Amazon QuickSight: Dashboard sharing, email reports
Feature: Learning Curve · Looker Studio: Low · Amazon QuickSight: Medium
Pricing Deep Dive
For a team of 5 dashboard builders and 50 occasional viewers:
Looker Studio: $0/month (free) or $495/month (Pro for all 55 users)
QuickSight: 5 Authors x $18 = $90 + 50 Readers x $5/month cap = $250. Total: $340/month. But if readers only check dashboards once a week, actual cost drops to ~$150/month.
QuickSight's session-based pricing wins when you have many casual viewers. Looker Studio wins when budget is the primary constraint (it is free).
When to Choose Looker Studio
- Your data is primarily in Google's ecosystem (GA4, Ads, Sheets, BigQuery)
- Budget must be zero
- Non-technical users need to build reports
- You need 1,000+ third-party connectors
- Speed of setup is the priority
When to Choose QuickSight
- Your data warehouse is on AWS (Redshift, S3, Athena)
- You have many casual viewers (session pricing saves money)
- You need embedded analytics with row-level security
- ML insights (anomaly detection, forecasting) are valuable
- You need paginated reports for compliance
Skip Both — Try Graphed
Both tools lock you into an ecosystem and require manual dashboard building. Looker Studio ties you to Google. QuickSight ties you to AWS. Both expect you to build every chart by hand.
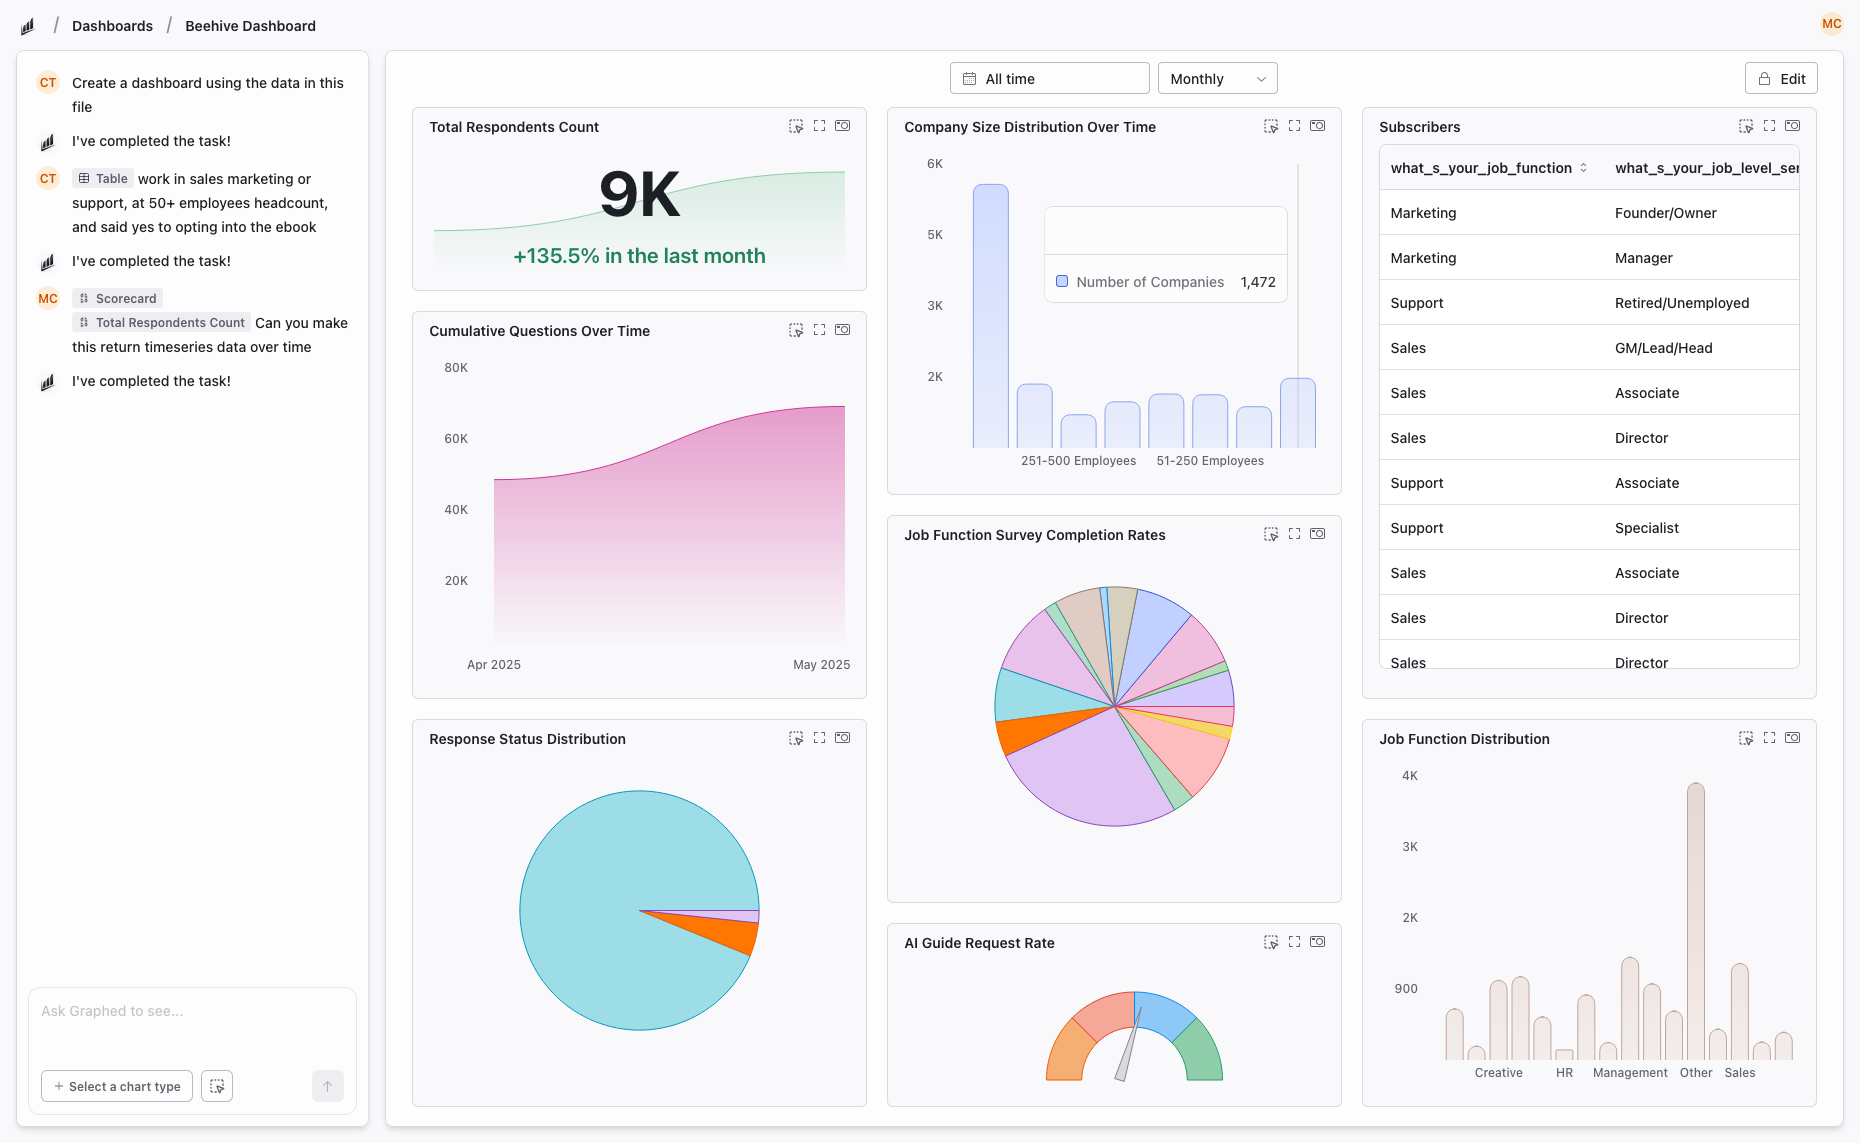
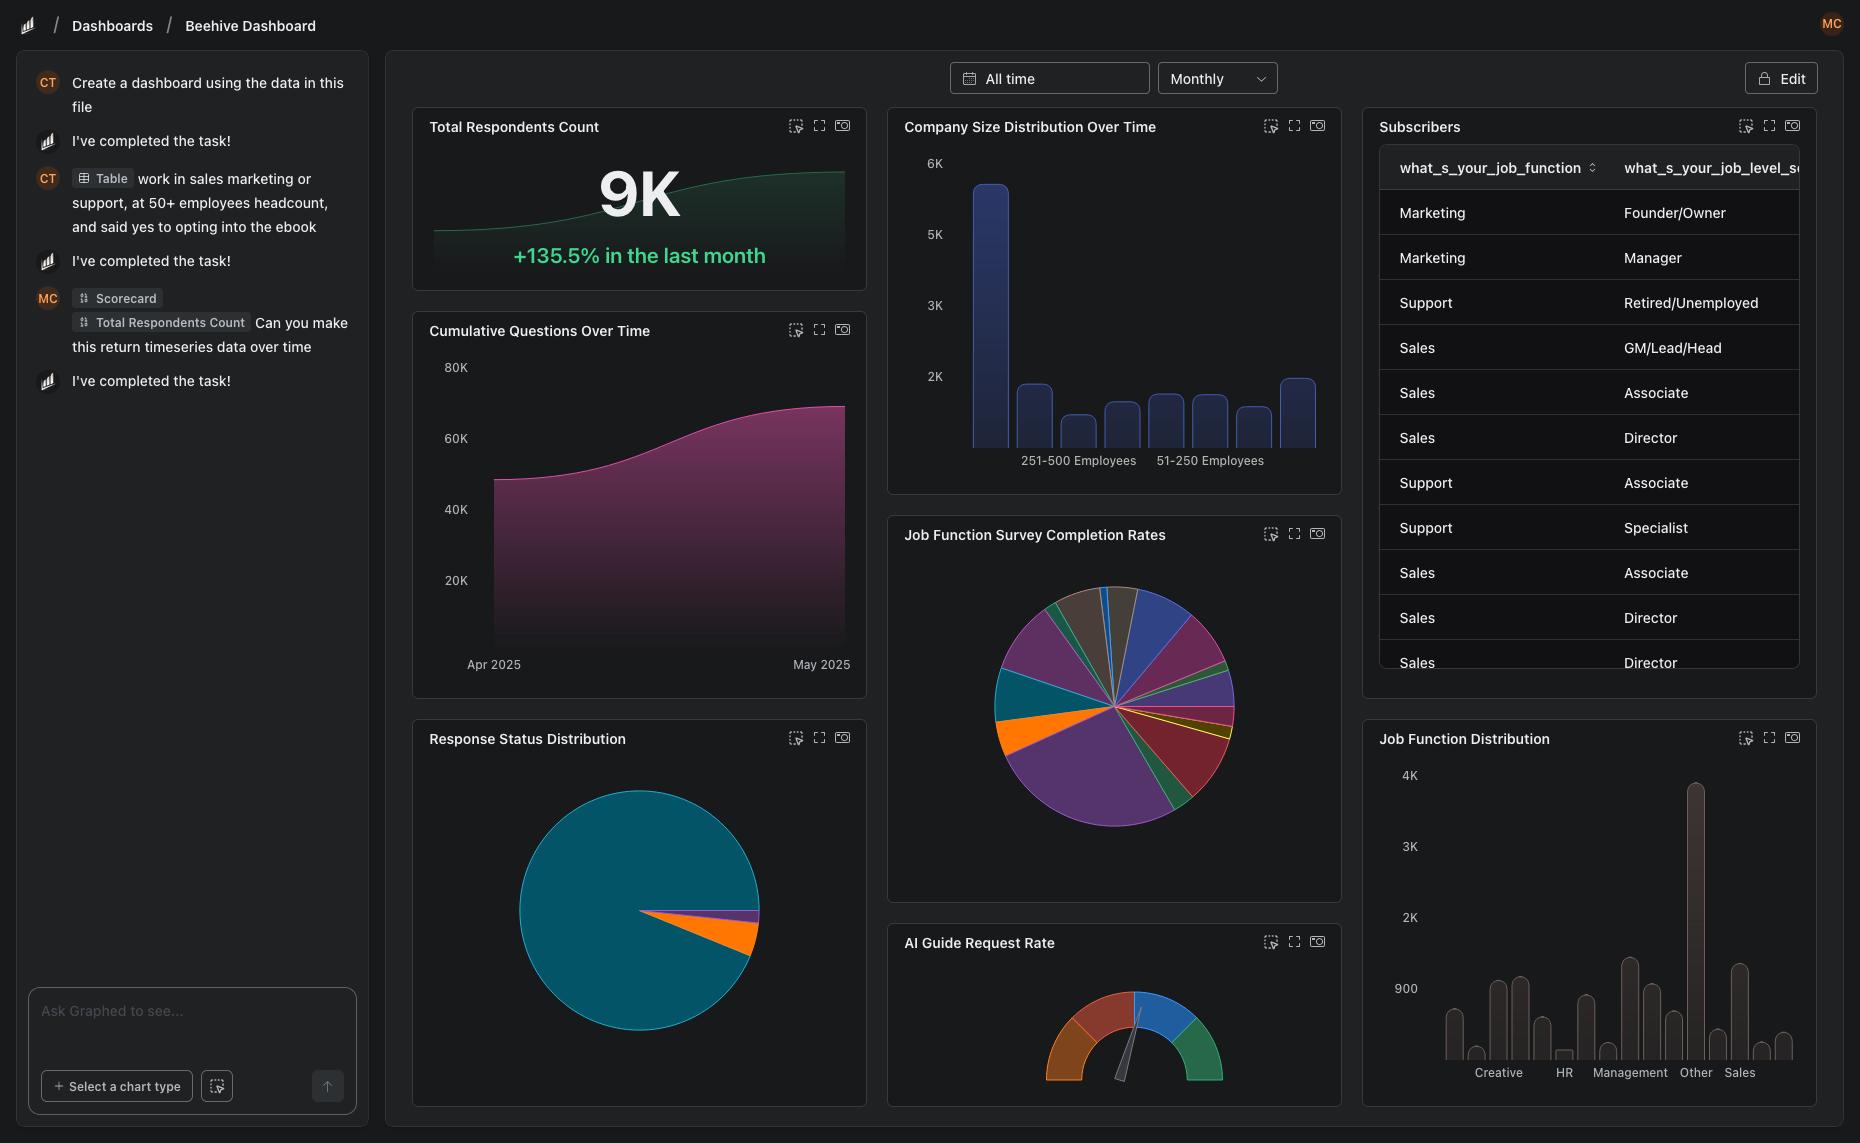
Graphed is an AI data analyst that connects to data sources across both ecosystems — and 350+ others including GA4, Google Ads, Meta Ads, HubSpot, Shopify, Stripe, and Salesforce. Describe what you want in plain English, and the AI builds the dashboard. No SPICE configuration. No drag-and-drop. No ecosystem lock-in.
Data syncs hourly. Setup takes 15 minutes. First dashboard in 24 hours. If you are choosing a BI tool based on which cloud your data lives in, Graphed makes that choice irrelevant.
The Bottom Line
Looker Studio and QuickSight serve different ecosystems. If you are a Google shop, Looker Studio is the obvious starting point. If you are an AWS shop, QuickSight's native integration and session-based pricing make it compelling. The tools rarely compete head-to-head because teams tend to pick the one that matches their cloud provider.
The bigger question is whether either tool's approach — manually building dashboards on top of cached data — is the best use of your team's time.
Related Articles
How to Create a Photo Album in Meta Business Suite
How to create a photo album in Meta Business Suite — step-by-step guide to organizing Facebook and Instagram photos into albums for your business page.
Is Google Analytics and Data Analytics the Same?
Is Google Analytics and data analytics the same? No — Google Analytics is one tool, data analytics is the broader discipline. Here is the difference.
What Database Does Tableau Use?
What database does Tableau use? Tableau connects to 100+ databases — it does not store data itself. Learn how live connections and extracts work.